I had dashboards showing me numbers — CPU, memory, network throughput. What I didn’t have was any way to answer “what actually happened?” When did someone try to log in? What did the firewall block? Those answers live in logs, and my logs were scattered across machines, unread.
This post is how I pulled them into one searchable place. That’s a SIEM — Security Information and Event Management — and you can build a simple one at home.
Stack: Loki · Promtail · rsyslog · Grafana · Docker
Metrics vs. logs (why I needed both)
Two different questions:
- Metrics answer “what’s the number?” — CPU is 40%, disk is 80% full. That’s Prometheus, which I already run.
- Logs answer “what happened?” — a specific event, with text. “User bill ran sudo at 21:04.” “Firewall blocked 203.0.113.5.”
A dashboard of numbers won’t tell you someone tried to brute-force your SSH. A log will. So this project fills the gap: centralise the logs, make them searchable.
Why Loki, not Splunk
Splunk is the big commercial SIEM. I used it in a TryHackMe class and it’s powerful — but it’s heavy, and it hides how things work behind pre-built packages. For a homelab it’s overkill.
Loki is the lightweight alternative from the makers of Grafana. Three reasons it fit:
- It’s light enough to run on a small VM.
- I already run Grafana, and Loki plugs straight into it — so I read logs in the same tool I read metrics.
- It makes me do the log parsing, which is the part actually worth learning.
The key thing to understand: Loki has no interface of its own. You read the logs through Grafana. There’s no separate “SIEM app” — Grafana is the window.
The pieces
log files ──► Promtail ──► Loki ──► Grafana (read here)
- Loki — stores the logs and answers searches.
- Promtail — the shipper. It watches log files and sends new lines to Loki.
- Grafana — where I type searches and read results.
Both Loki and Promtail run in Docker. Loki is bound to 127.0.0.1 (localhost only), so nothing on the network can reach it directly — only Grafana, running on the same machine. Same locked-down approach as the rest of my lab.
The three log sources
I wanted three things flowing in:
| Source | What it tells me |
|---|---|
auth.log | Logins, sudo, SSH attempts — the security log |
syslog | General system events — cron, services, kernel |
| pfSense | My firewall — every block, every connection |
The first two live on the server itself. The third — pfSense — is the interesting one, because it’s a firewall, and firewalls log the security-relevant stuff: what got blocked, who connected, VPN activity.
What went wrong (the honest part)
The plan was simple. The execution was a series of small walls. Each one taught me something, so here they are.
Wall 1: Promtail couldn’t read the system journal
Modern Debian stores logs in the systemd journal (a binary format), not plain text files. I pointed Promtail at it and got:
support for reading the systemd journal is not compiled into this build
The standard Promtail image just doesn’t include that feature, and the special version that does no longer exists for current releases. Dead end.
Fix: stop using the journal. Read plain text log files instead — which meant installing rsyslog, the classic logging tool, to generate them. (Debian 13 doesn’t install it by default anymore.) Once rsyslog was running, /var/log/auth.log and /var/log/syslog appeared, and Promtail could tail them like normal files.
Lesson: the simplest, oldest approach (plain text files) was more reliable than the modern one. Worth remembering.
Wall 2: pfSense speaks an old dialect
pfSense sends its logs over the network using syslog — a standard protocol for shipping logs between machines. Promtail can receive syslog directly, so I set that up. Every packet arrived and was thrown away:
expecting a version value in the range 1-999
Syslog has two versions: an old format (RFC 3164, from the 80s) and a new one (RFC 5424). Promtail only understands the new one. pfSense sends the old one. They couldn’t talk.
Fix: put rsyslog in the middle. rsyslog understands both formats. So pfSense sends to rsyslog, rsyslog writes it to a file, and Promtail tails the file — the same reliable pattern as the other two sources. Everything now flows through one path: file → Promtail → Loki.
Lesson: when two things can’t talk, a translator in the middle often beats forcing one to change.
Wall 3: the small, maddening ones
Three quick traps, each of which cost time:
- rsyslog listened on the wrong network type. By default it grabbed the IPv6 address; pfSense sends over IPv4. They were on the same port but different lanes. Fix: tell rsyslog explicitly which IP to listen on.
- rsyslog wouldn’t create the log file. It received the data fine but silently refused to create a new file — though it happily writes to one that already exists. Fix: create the empty file myself first (
touch), then it worked. - Grafana showed nothing even though the data was there. Two causes: the time range was set too narrow (default “last 5 minutes”), and — the real one — I’d never actually saved the Loki connection in Grafana. Built the config, never clicked save.
That last one is a theme across my whole lab: “looks configured” and “is configured” are different things. The proof is always in testing the actual thing, not admiring the settings.
Wall 4: I couldn’t open the log viewer
Grafana’s log-reading screen (Explore) was greyed out — “no permission.” I’m the admin, so this was confusing.
The catch: my Grafana login comes from my identity provider (single sign-on), and Grafana decides your role based on which group you’re in. It checks for a group literally called Grafana Admins. I was an admin in the identity system, but not in that specific group. So Grafana treated me as a read-only viewer.
Fix: add myself to the Grafana Admins group, then log out and back in — because the role is only checked at login.
Lesson worth keeping: who you are and what you’re allowed to do are separate. Being an admin in one system means nothing in another unless that system is told to trust the right group.
The payoff
After all that, three log sources land in Loki and I read them in Grafana’s Explore view using LogQL — Loki’s search language. A few examples:
{job="auth"} |= "Failed password"
Every failed SSH login. Empty right now — but this is the line that lights up during a brute-force attack.
{job="pfsense"} |= "filterlog"
Every firewall block and pass decision.
{job="syslog"}
Everything the system is doing.
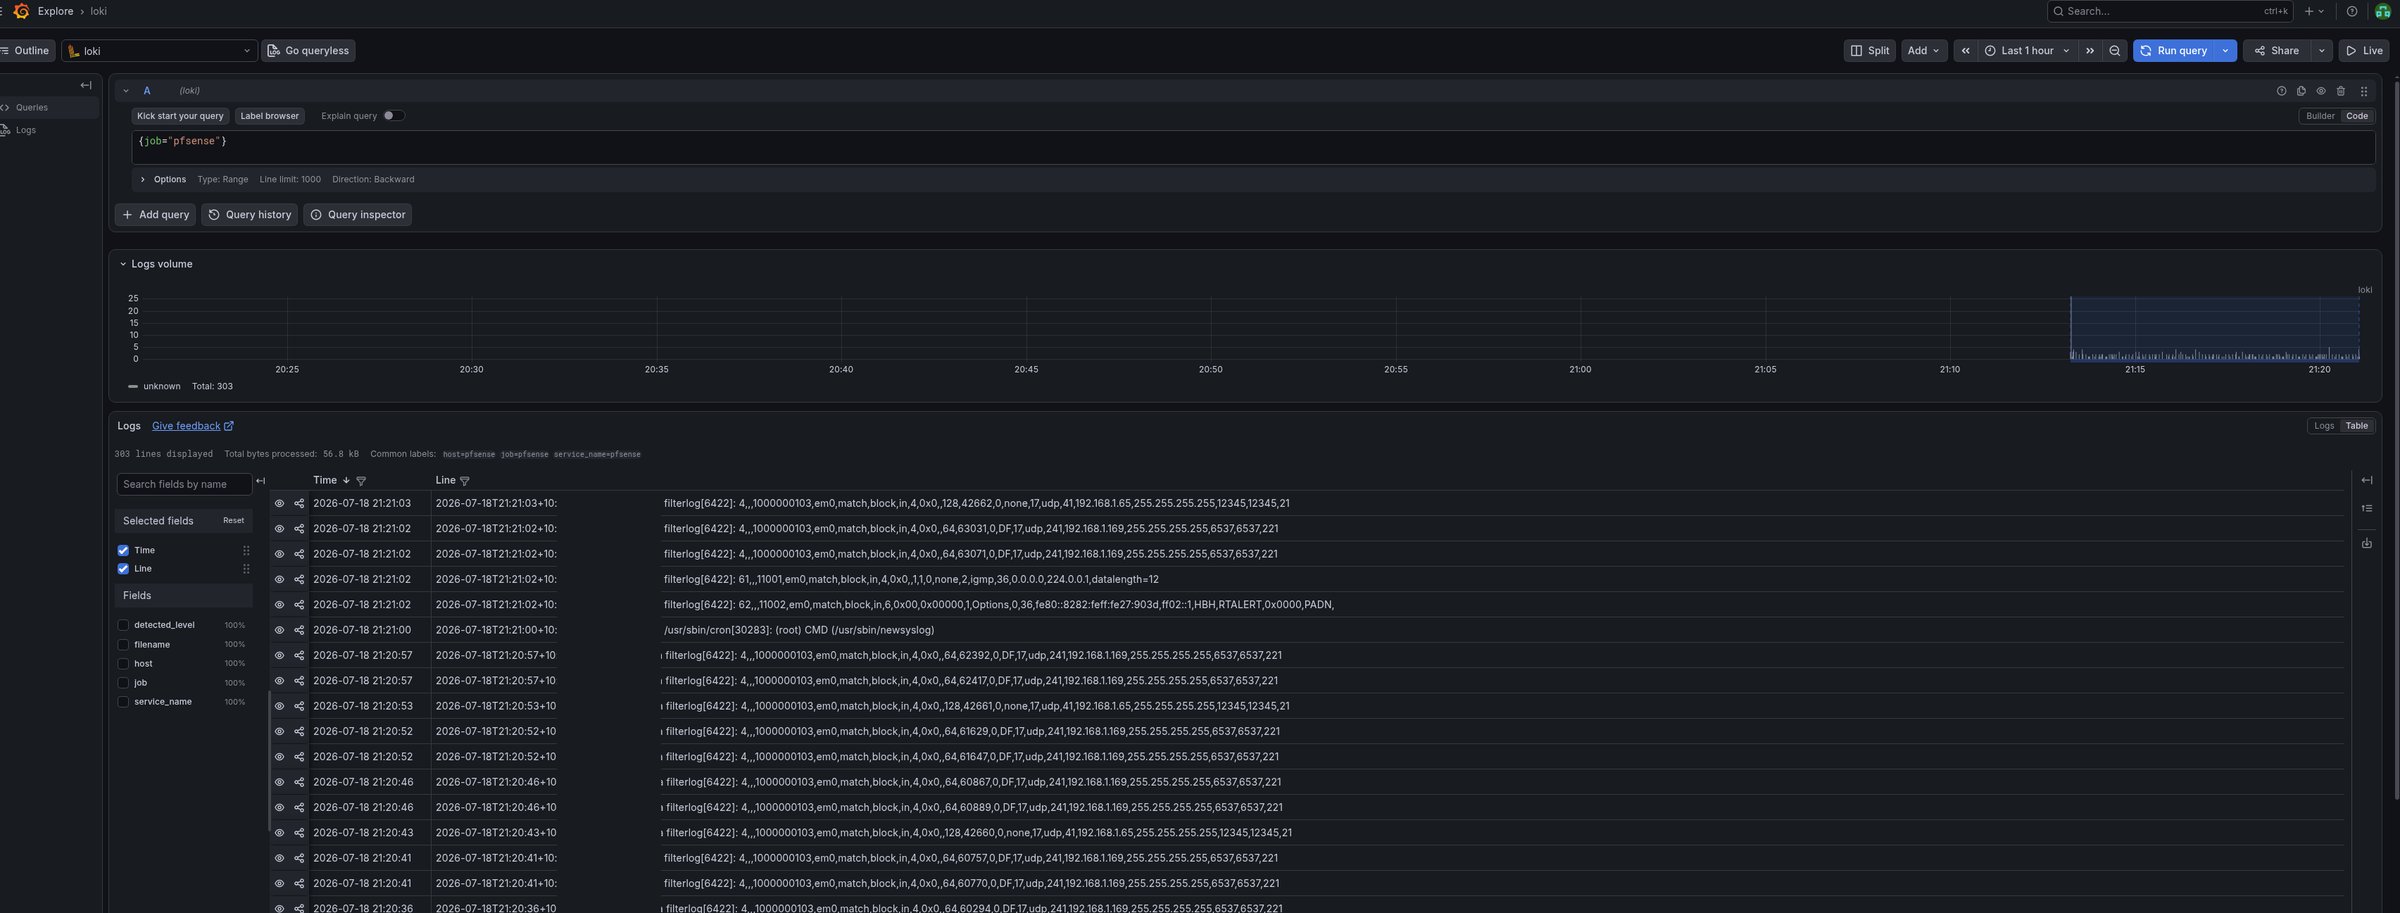
Above each search, Grafana draws a bar chart of log volume over time — so a sudden spike in failed logins becomes something you see, not something you have to go looking for. That’s the SIEM idea in one picture.
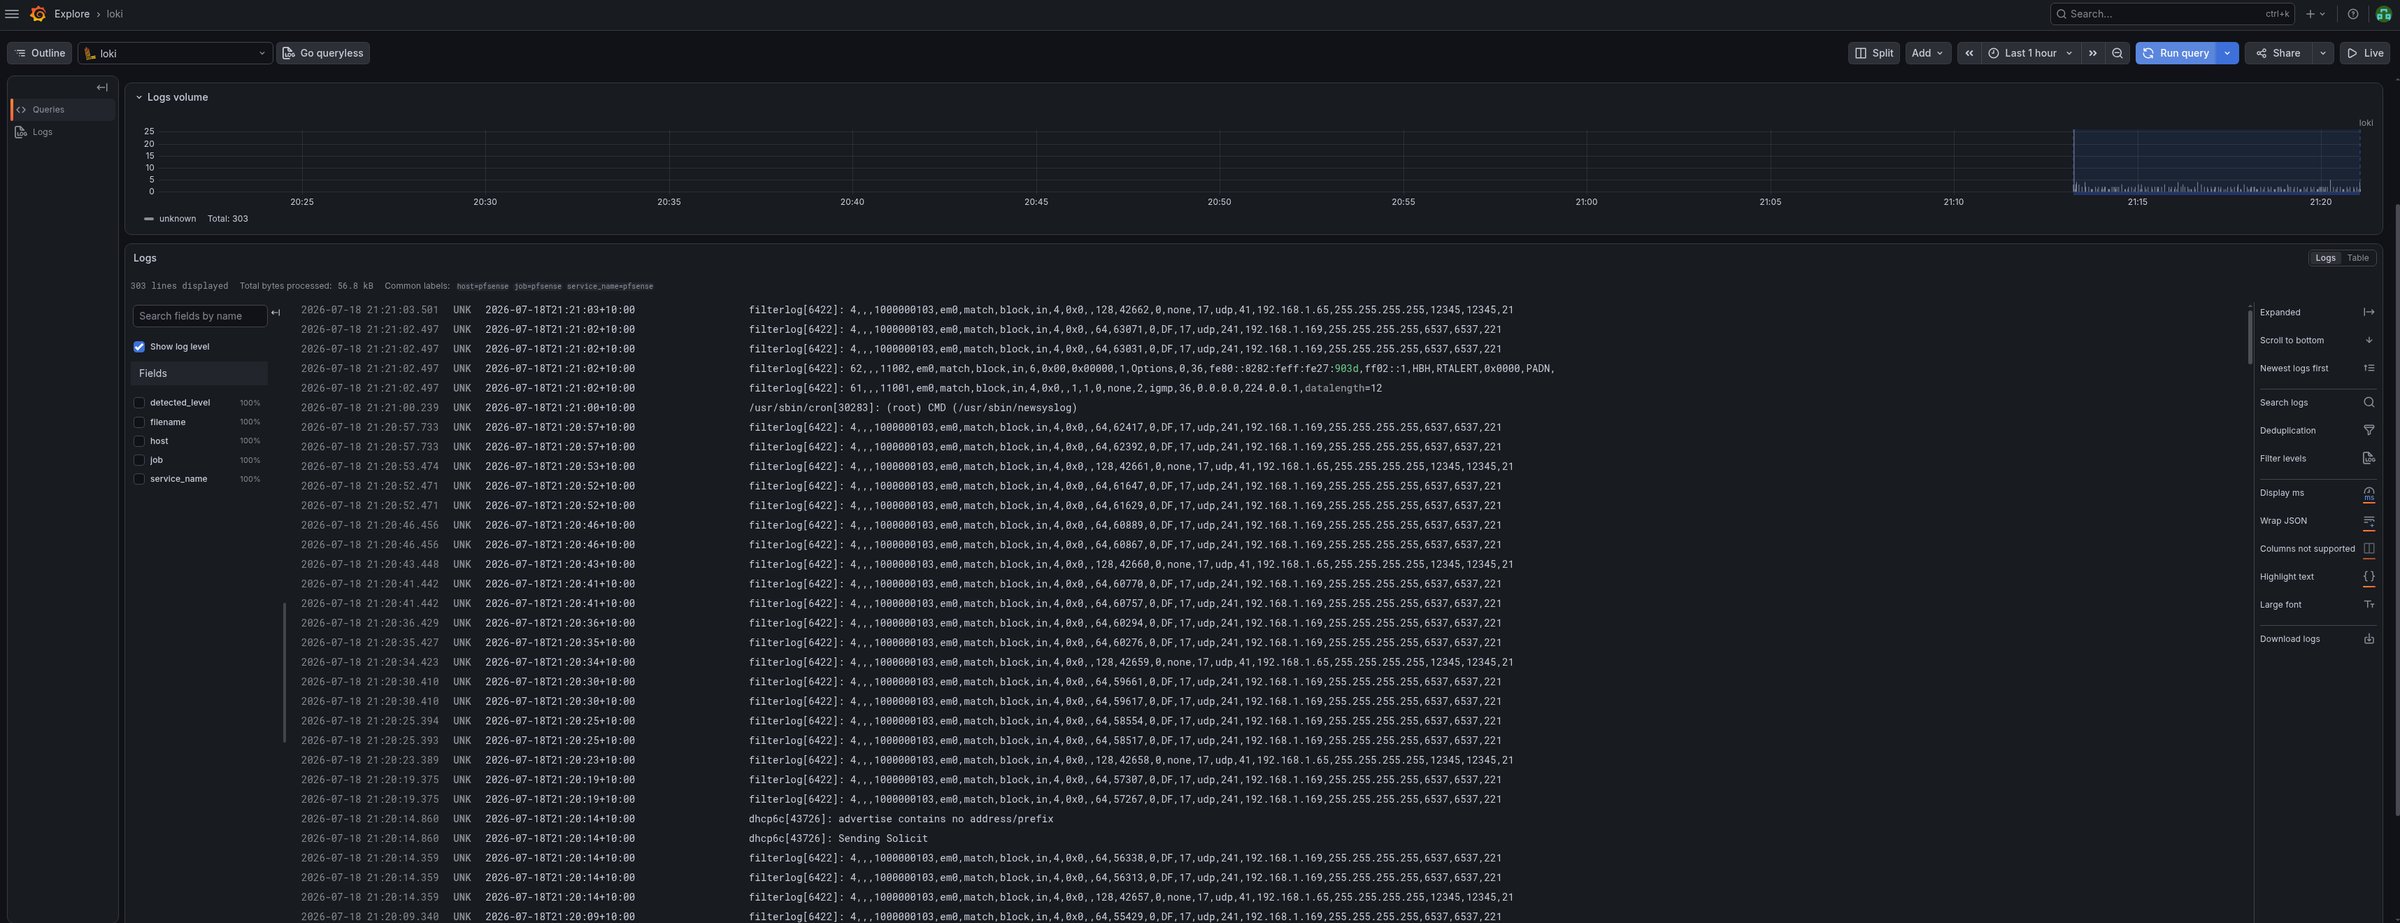
What’s a SIEM, really?
At its simplest, a SIEM does three things:
- Collect logs from everywhere into one place. ✅ Done.
- Search them quickly. ✅ Done.
- Alert on suspicious patterns automatically. ⏳ Next.
I’ve built the first two. The third — “tell me when there are 10 failed logins in a minute” — reuses the alerting system I set up last time. That’s the next session.
There’s also a step between search and alert: parsing. Right now a firewall log is one long line of comma-separated values. To ask useful questions — “top blocked IP addresses” — I need to split that line into named fields: source IP, action, port. That field-extraction is the real craft of a SIEM, and it’s what turns “searching text” into “analysing security data.” Also next session.
Takeaways
- Metrics tell you the number; logs tell you the story. You need both.
- A homelab SIEM is just: collect logs, search logs, alert on logs. Loki does it without enterprise weight.
- The plain, old approach often wins — text files beat the fancy journal reader, and a translator in the middle beat forcing two protocols to match.
- “Configured” isn’t “working.” Every wall here looked fine in the settings and failed in reality. Testing the actual thing — watching the packets, checking the file, saving the datasource — is what finds the truth.
- Identity and permission are different. Being an admin somewhere doesn’t grant access everywhere.
The build was maybe an hour of real work and several hours of walls. But the walls are where the learning was — and now I can actually read what my network is doing, instead of hoping.
Next: teaching the SIEM to parse firewall logs into proper fields, building a security dashboard, and alerting on suspicious patterns — the part that turns log storage into log analysis.