My homelab keeps growing — more containers, more services, a multi-LLM setup on top. Security is the priority for all of it: guard rails, hooks, and strict policies everywhere, to the point that my main Claude agent is audited by Codex, with Kimi as a third read-only reviewer I invoke manually through the council dashboard.
What it didn’t have was a place to see any of that. So: a SOC. A centralised security view for the lab, and a genuinely useful thing to have built.
The rule I set was that the dashboard came last. A single pane over sources that aren’t shipping, or detections nobody has proven fire, looks like coverage and behaves like decoration. Logs first, then detections, then the view.
How this was built
I run this lab as an AI-assisted workflow. I direct the agents, decide what changes, run anything needing root, and push back on answers that smell wrong. Claude Code did the investigation, wrote the config and the rules, and took every measurement in this post. I didn’t type the LogQL, and I’m not going to pretend otherwise.
That’s not a disclaimer, it’s the interesting part. Two of the defects below were introduced by the agent and caught later by insisting on evidence — one of them within the same afternoon it shipped.
The finding: only the firewall was talking
The lab had identity (Authentik), a reverse proxy (Caddy) and a firewall (pfSense). Only pfSense produced security telemetry.
- Authentik’s events sat in its own database, never shipped.
- Caddy wrote no access log at all —
grep -cforlogdirectives in the Caddyfile returned0. - 28 containers logged to
json-filewith nothing reading them.
Nothing needed installing. It was a sources gap, not a tooling gap, which is the kind that hides well because every service looks healthy.
Volume was never the constraint. Measured against Loki’s 4 MB/s ingest limit:
| source | rate | % of limit |
|---|---|---|
| existing file sources | 0.24 KB/s | 0.006% |
| all 28 container logs | 0.52 KB/s | 0.013% |
| combined | 0.76 KB/s | 0.019% |
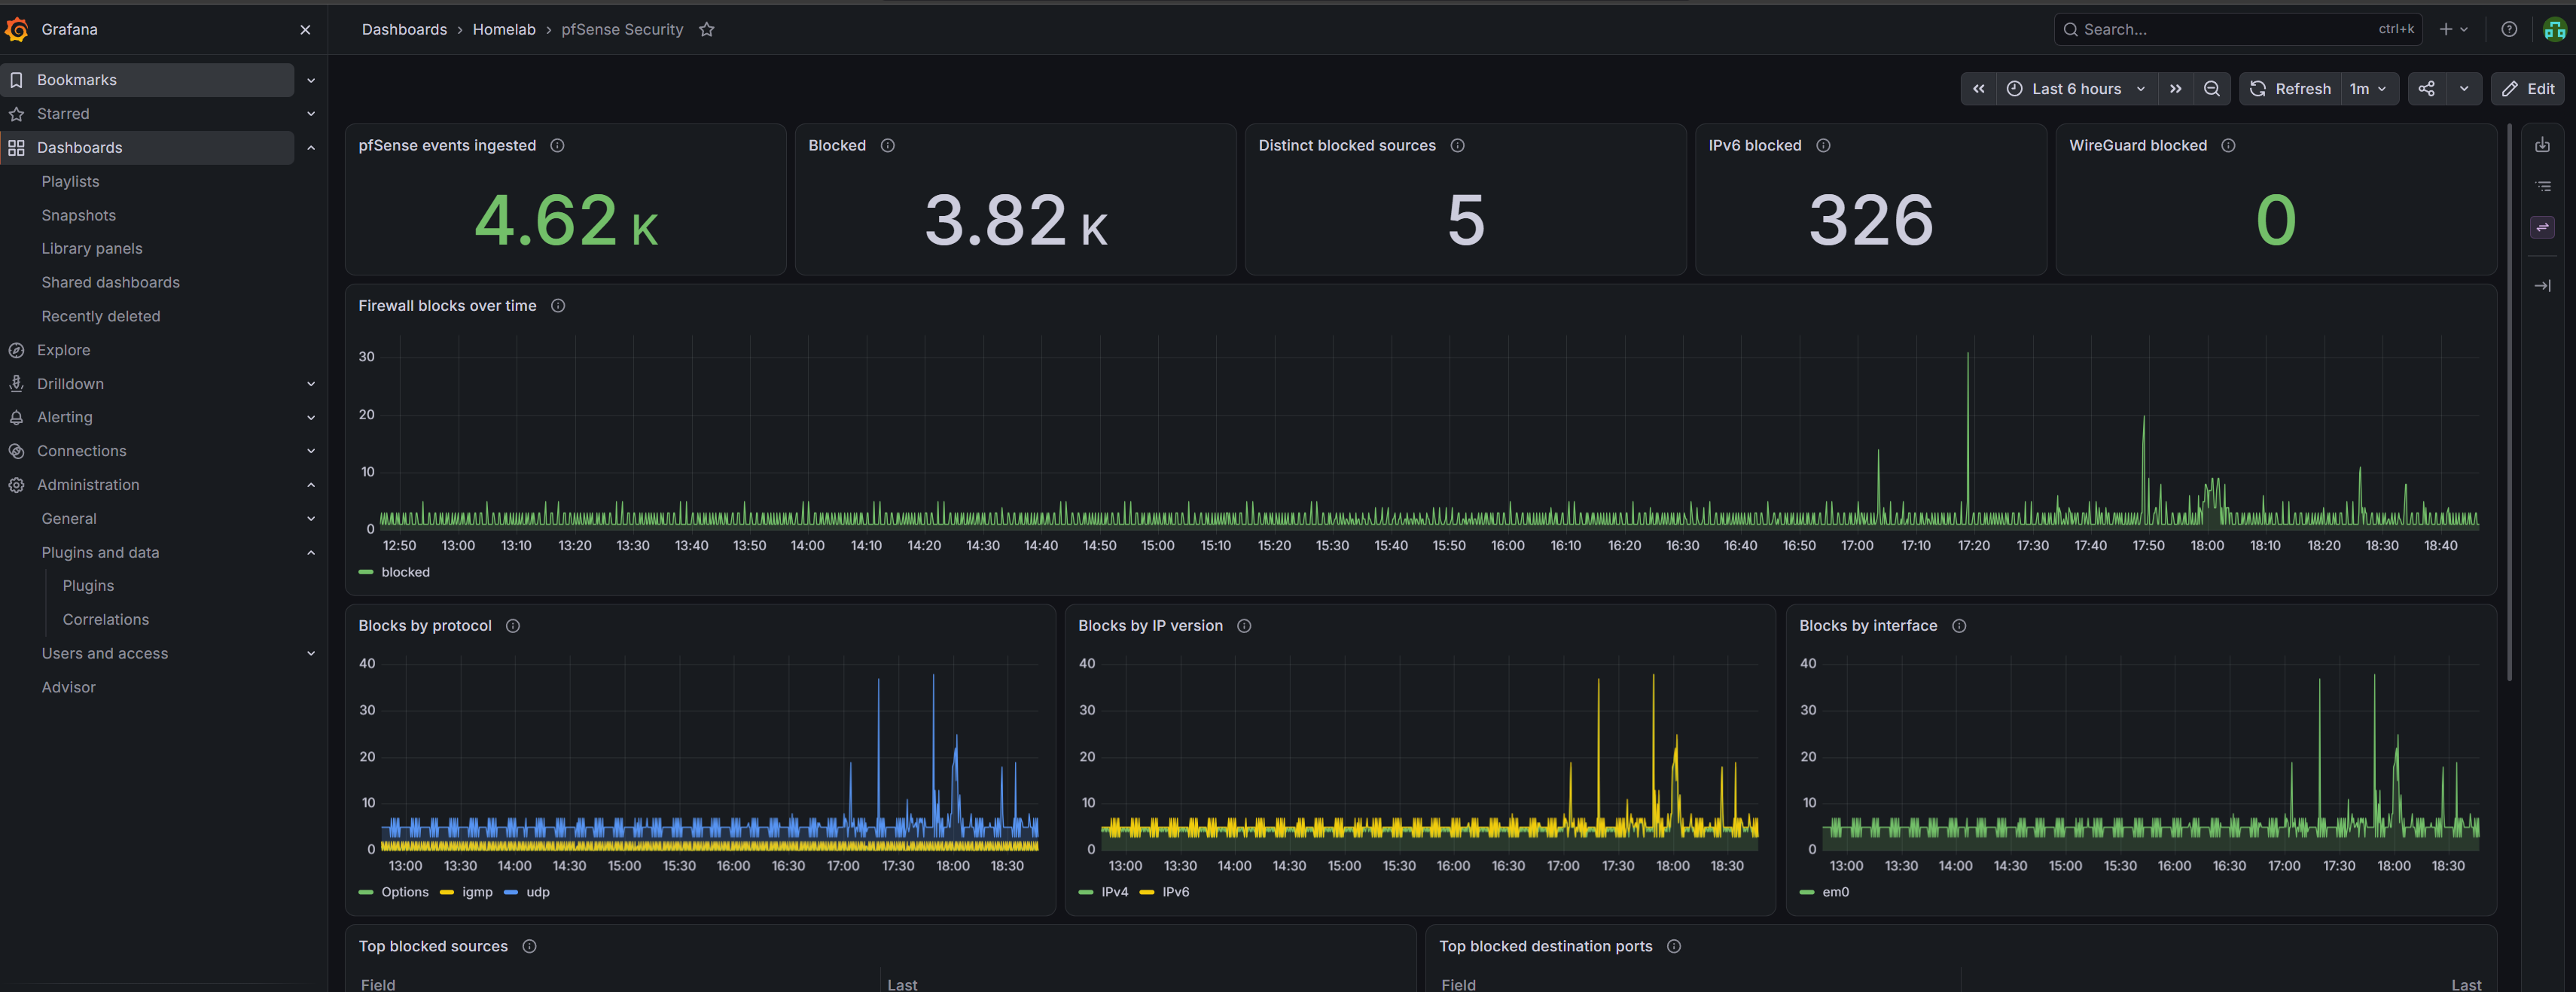
The useful result there was a negative one. Thirty minutes of Authentik’s stdout was health checks and outpost polls with zero login-shaped lines — so shipping container logs could never have delivered identity telemetry, however well it was done. That needed its own exporter reading Authentik’s database.
One deliberate refusal: Promtail reads Docker’s json-file logs directly rather
than using docker_sd_configs, which needs /var/run/docker.sock mounted in.
The Docker API socket is a host-root escalation path and :ro doesn’t help,
because the risk is the API, not the file. On a project about security posture,
that’s not a trade worth making to get container names in labels. The cost is
real and accepted: streams are labelled by container id, not name.
The detection that had never fired
This rule had been sitting in the file since the start:
sum(count_over_time({job="auth"} |= "Failed password" [5m])) > 10
Thirty days, zero matches. A note in the file said so and drew the right conclusion — an untested detection is not a working detection — then asked for a controlled run of failed logins. Nobody had done it.
Zero matches has two explanations that look identical from outside: nothing is attacking the box, or the rule is broken. Both are silence.
Working backwards, the auth job was shipping fine — 349 lines in 24h — but
none of them were sshd. That looked like the answer for about a minute, until a
wider query found 13 sshd lines over 30 days. The pipeline was fine. The host is
just quiet. Those 13 were my own vulnerability scanner probing SSH: connection
failures and srclimit_penalise, never a password attempt. Which is exactly why
a password-failure rule saw nothing.
So, two failed logins against localhost as an invalid user. Two, not eleven —
fail2ban’s effective ignoreip can’t be read without root and it’s commented
out in jail.local, so whether loopback was exempt was genuinely unknown. Two
sits below any plausible maxretry and can’t cause a ban.
Both reached Loki and the rule’s own expression counted them: 2. The rule was
correct all along. What it lacked was evidence.
A Loki bug hiding in plain sight
While measuring a baseline for a companion rule, a query came back 0 that had
no business being zero. Dropping one branch from the regex made it return 5 —
and adding an alternative to a regex can only add matches. That’s not a
threshold problem, it’s a wrong answer.
Narrowed down against real data:
|~ "sudo.*(password)"       -> 37     correct
|~ "sudo.*(password|zzz)"   ->  0     WRONG
|~ "(zzz|sudo.*password)"   ->  5     correct
|~ "sudo.*[p]assword"       -> 37     correct
Python’s re matches lines 1 and 2 identically on the same file. So Loki 3.7.6
is wrong, not the regex: a .* followed by a multi-branch group silently
returns nothing. Almost certainly its line-filter optimiser pulling out
required literals and AND-ing them instead of OR-ing.
It does not error. It returns zero — which in a detection rule is indistinguishable from “nothing bad happened”. A rule written that way is a quiet alert forever.
Two deployed rules used alternations, so those got checked immediately. Both are
top-level with no leading .*, and one returns exactly its two branches’ 21 +
108 = 129, so it’s provably summing correctly. Sound, by luck of how they
happened to be written. That luck is now a warning at the top of the rules file
with the safe shapes spelled out.
The threshold I got wrong
Here’s the one that was my own fault, or rather the agent’s and mine for accepting it.
A new rule shipped at “more than 5 rejected sudo passwords in 5 minutes”, with a comment saying the observed baseline max was 2. An hour later, checking something unrelated, that number stopped making sense.
Loki’s retention here is 168 hours. A query over 30 days doesn’t error and doesn’t warn — it just returns 7 days. So a baseline “measured over 30 days” and one measured over 7 look identical in the output, and identical in the comment written afterwards. The “max of 2” was that same afternoon’s activity, which included the agent’s own timed-out sudo prompts.
The raw logs go much further back. Re-derived from auth.log and its rotations
— 28 days, 6,994 lines:
ssh Failed password   0 buckets    (never, excluding the test above)
sudo auth failure    17 buckets    median 1   p95 12   max 12
Against a real max of 12, > 5 would have fired on ordinary use. Looking at the
outlier rather than just the number: one bucket of 12, one of 4, fifteen of 1–2,
every line reading auth could not identify password for [student]. That’s me
losing a fight with a password prompt, not an attack. Raised to > 15.
The older thresholds turned out fine — the firewall rule claims a window
starting 2026-07-18, and pfsense.log genuinely starts 2026-07-18, so whoever
wrote it had read the raw file. The rules file now says to do exactly that, and
why.
Turning on the access log without leaking credentials
Caddy fronts every service in the lab and logged nothing. The reason it stayed
that way is that switching it on isn’t free: Caddy sits in front of Authentik,
so OAuth redirects arrive as ?code=...&state=... on the URI. Logging raw
requests would write live authorization codes into a file that then ships into
Loki — an observability gap upgraded to a credential leak with better search.
So the config leads with redaction:
format filter {
    wrap json { time_format rfc3339_nano }
    fields {
        request>uri query {
            replace code REDACTED
            replace state REDACTED
            replace access_token REDACTED
        }
        request>headers>Cookie delete
        request>headers>Authorization delete
        resp_headers delete
    }
}
Cookies and Authorization are deleted rather than hashed. Nothing here needs
to correlate sessions, and a hash of a session cookie is still a stable
identifier for one.
Verifying this by noting that no secret appeared would have proved nothing —
no secret appeared in requests that never carried one. The test has to carry the
thing you’re trying not to log. One request with a unique canary in every field
the filter claims to strip, plus a harmless= parameter that should survive:
uri: /?access_token=REDACTED&code=REDACTED&harmless=CANARY..._KEEPME
     &id_token=REDACTED&refresh_token=REDACTED&state=REDACTED&token=REDACTED
headers: {"Accept":["*/*"],"User-Agent":["curl/8.14.1"]}
Zero canaries anywhere in the file, and harmless= intact. That second half
matters as much as the first: it proves the filter removes things by name
rather than blunting the whole query string, which would make the log useless
for the thing it exists for.
That resp_headers delete line started as a size trim — response headers were
487 of 1,237 bytes per line, all static boilerplate. Reading it before deleting
it turned up something better. The query filter only rewrites request>uri.
Response headers also carry Location, and a proxied Authentik callback returns
a 302 whose Location can hold ?code=.... The redaction so carefully applied
to the request side had a matching hole on the response side. Deleting the
object closes it, and cuts 39% of the volume as a side effect.
The dashboard, last
Homelab Security Overview: 23 panels, four rows — ingest health, identity and access, reverse proxy, network and containers. Everything reads from Loki. Prometheus host metrics are deliberately absent; this is a security view, not a capacity one, and mixing the two is how a dashboard stops having a question it answers.
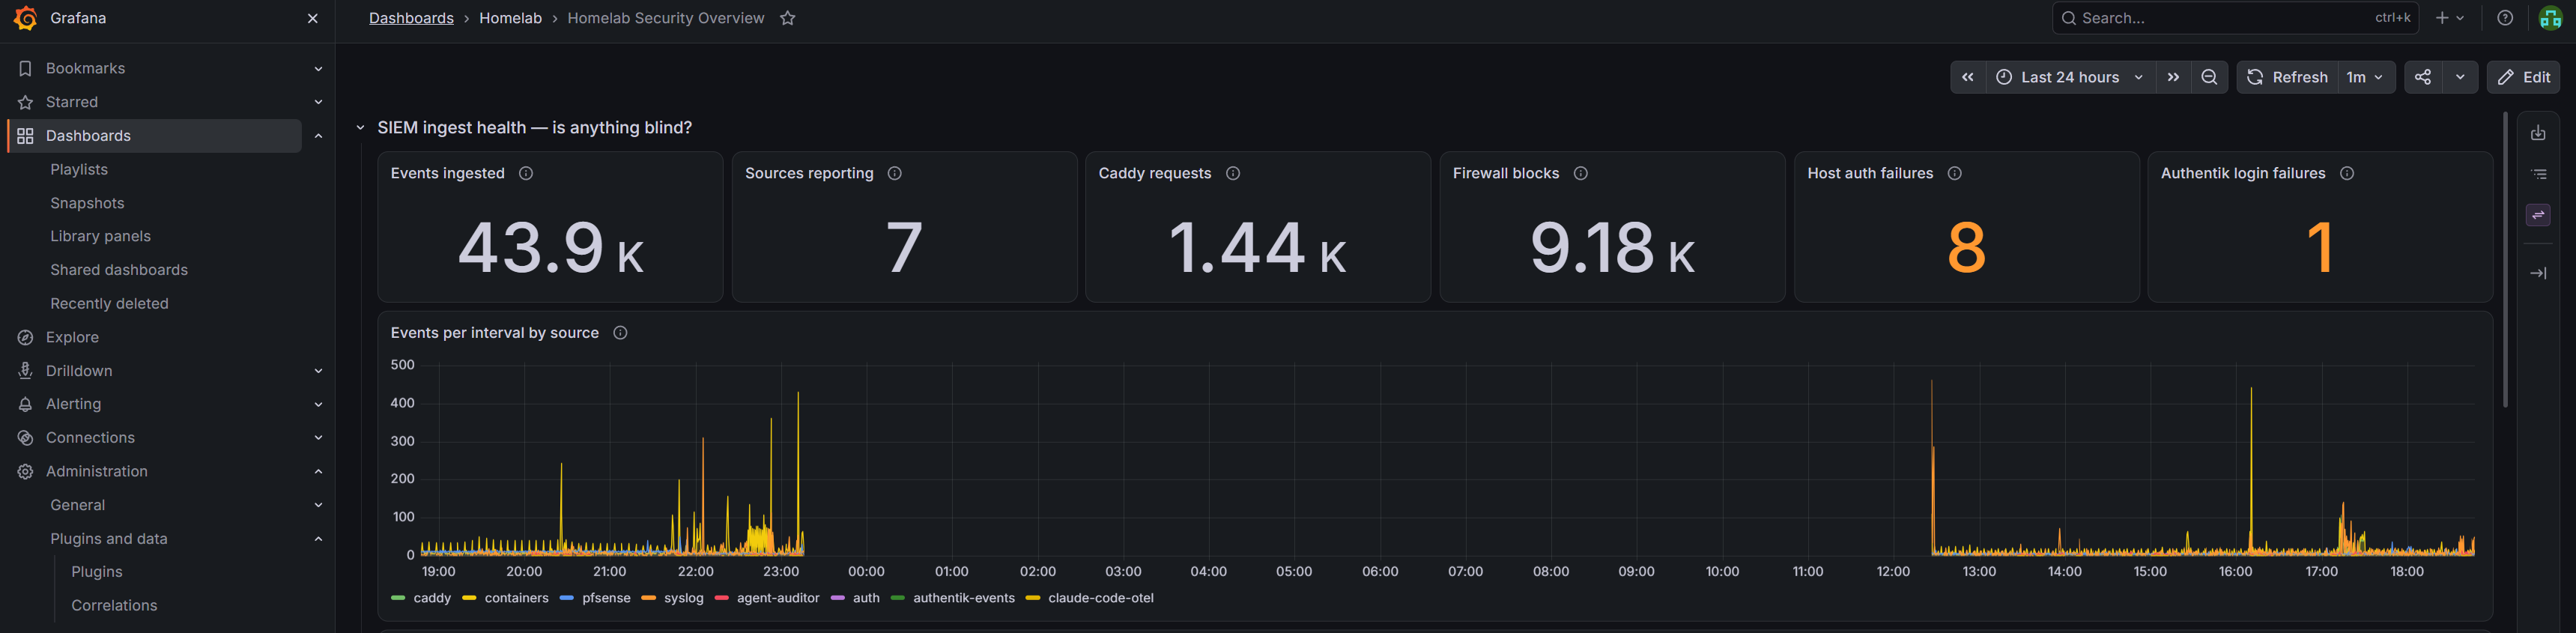
Every query ran against live Loki before the file was written: 22 returned data, 4 empty, 0 failed, 0 layout overlaps. The four empties got checked rather than accepted — they used a five-minute probe window and all four populate across the dashboard’s 24-hour range. Sparse, not broken. That distinction is the whole difference between a working panel and one that will never draw anything.
Two decisions worth keeping:
The per-source bar gauge uses eight explicit or vector(0) targets instead of
one grouped query. Loki returns no label value for a stream that has stopped,
so a grouped query makes a dead source disappear from the panel rather than
show zero — it would look healthiest at the exact moment it should be screaming.
Eight hardcoded targets always render a bar, and a bar at zero is the alarm.
The 4xx/5xx panel was validated by generating a real 404. The first attempt hit an Authentik-gated host, which redirects everything and produced a 302; two other hosts gave genuine 404s and the filter caught both with the right virtual host attached. An empty panel there now means no errors, rather than a filter that silently never matches.
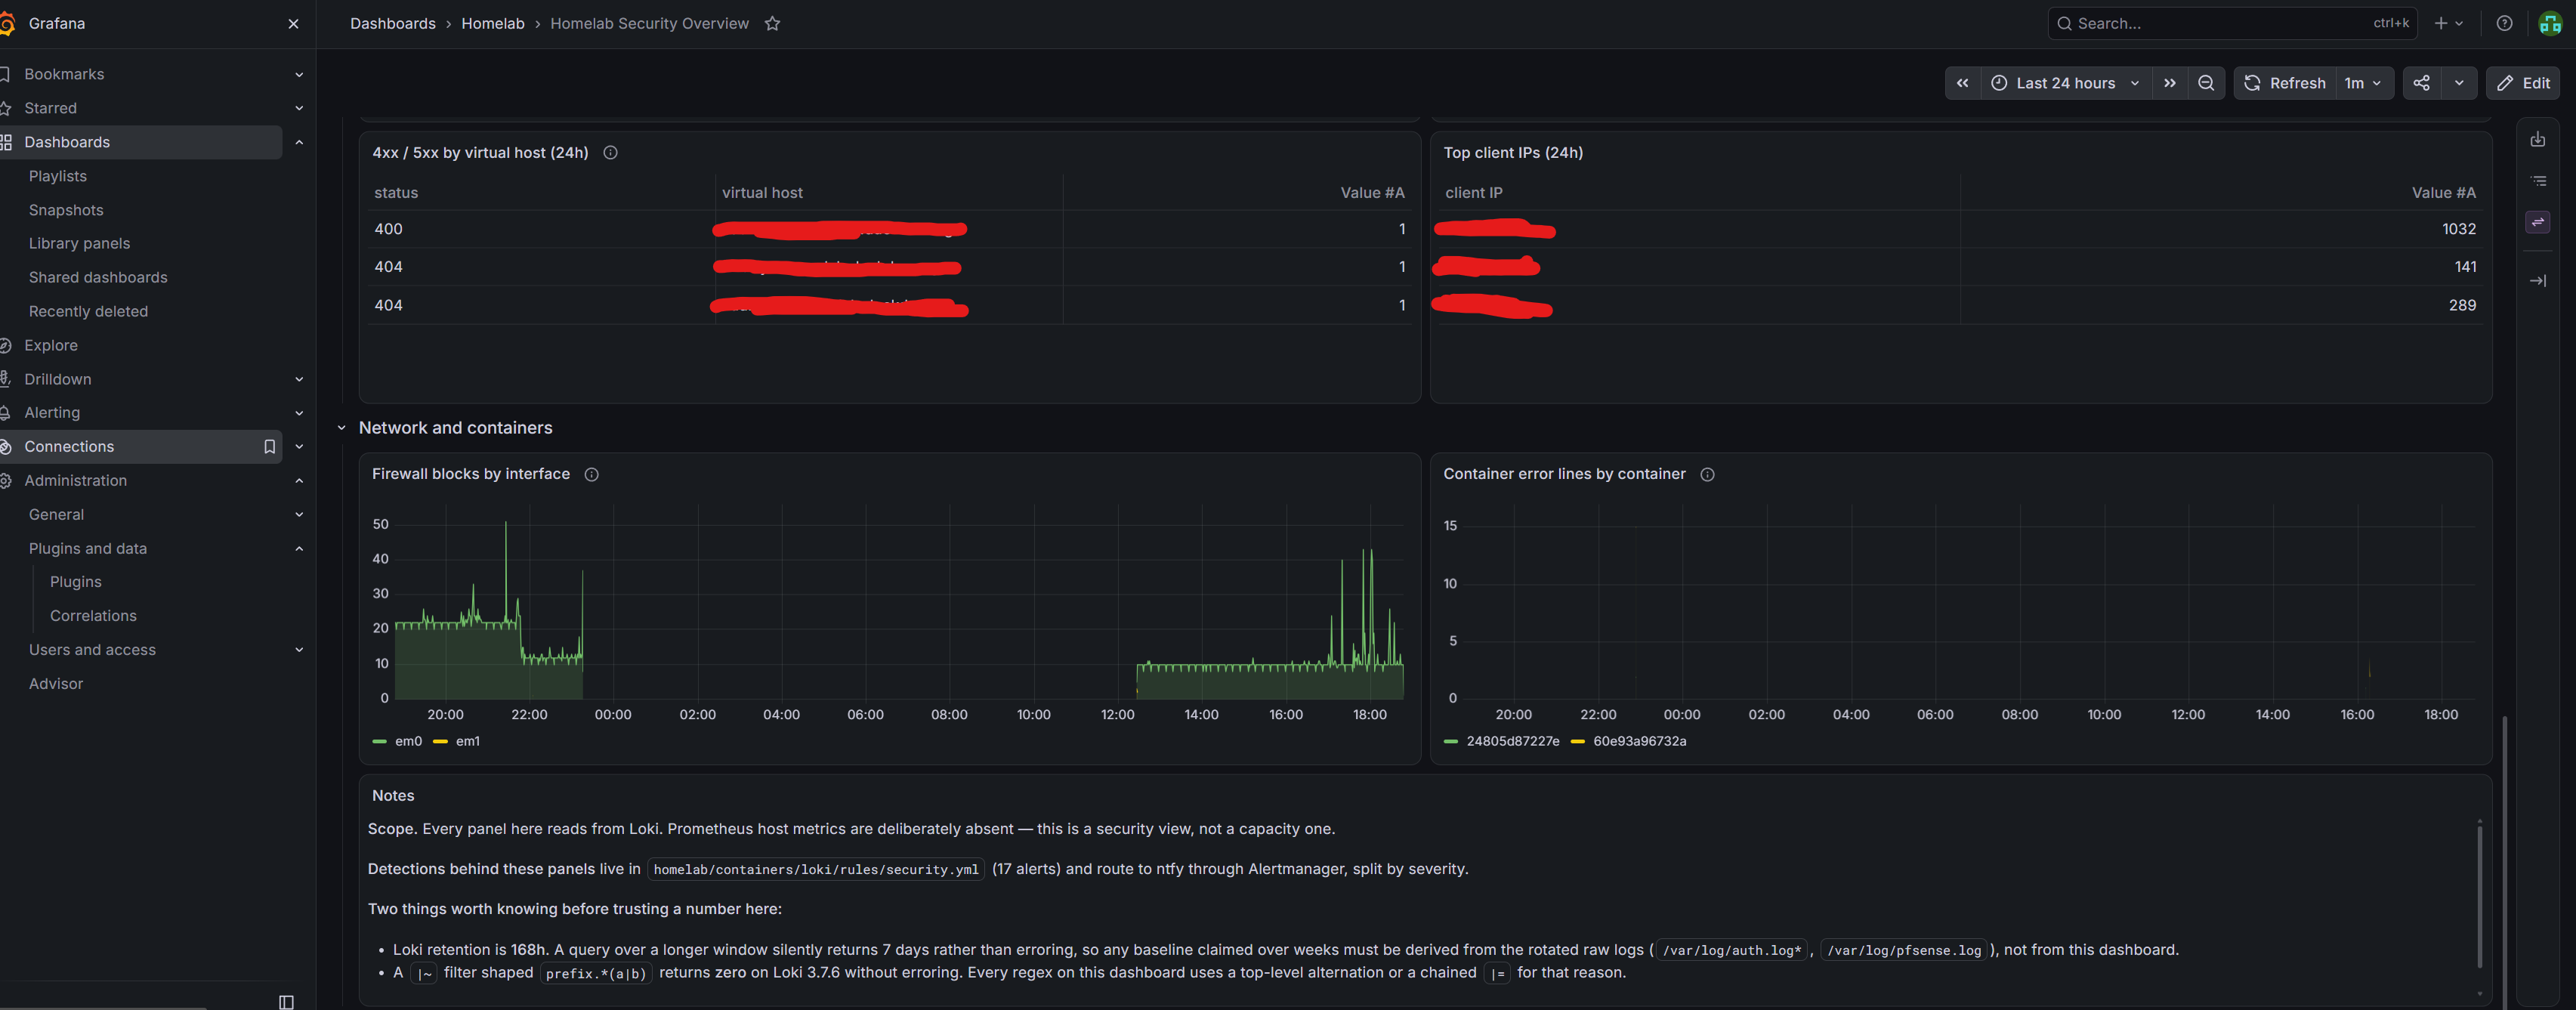
Both gotchas from this project are written into the panel descriptions: the retention that makes a 30-day query quietly return seven, and the regex that returns zero without erroring. A number on a dashboard is a claim, and whoever reads it should be able to see what it doesn’t know.
What’s still not right
The container error threshold can only ever have a 7-day baseline. A container’s
log file is deleted when the container is recreated, so unlike auth.log the
raw files aren’t the long-lived source — disk held 31 error lines where Loki
held 41 for the same window, because Loki keeps lines from containers that no
longer exist. Waiting longer doesn’t fix that; only raising retention would.
It’s at least derived now rather than guessed: 13 non-zero buckets over 7 days, median 8, second-highest 17, max 65. The threshold of 25 sits in the gap, and the one bucket above it was a real fault — Caddy timing out to Prometheus while Authentik outposts took 502s fetching their configuration. Confirmed rather than raised.
The live architecture — every source, the alert path, and what’s still open — is on the SOC page, and every rule with its expression and ATT&CK mapping is in the detection catalogue.
The honest summary of the whole project is that the sources gap was the easy part. The work was proving that what I’d built actually did what its comments claimed — and three separate times, it didn’t.