With the SOC built and an AI analyst sitting on top of it, the obvious gap was that both of them only knew about things that happened. Neither knew what my lab was supposed to look like in the first place.
So this project builds a baseline — a structured representation of the homelab, physical and logical — and then continuously checks reality against it. If a port opens that I know nothing about, I want to find out because it disagreed with the inventory, not because I happened to look.
Why a baseline matters
Threats come from everywhere: external, insider, or the far more common case — my own misconfiguration. You can run a next-generation firewall and still fail to notice something abnormal, because “abnormal” is meaningless without a definition of normal.
That definition is the whole point. Once I have a baseline, a change that happens without my knowledge stops being ambiguous. I don’t have to reason about whether a service looks suspicious. I only have to answer a much easier question: is it in the inventory or not?
How this was built, and by whom
Same working model as the last two projects, up front rather than in a footnote.
I design the workflow, decide what gets built and what doesn’t, approve each phase, type every root command myself, and do the analysis of whether a result is actually believable. Claude Code did the implementation — the observation engine, the diff engine, the persistence logic, the systemd units, the tests, the documentation — and most of the diagnosis. Kimi is the read-only analyst that investigates what the twin finds. Codex holds the integrity manifests.
I didn’t write the code and I’m not going to imply otherwise. What I did was set the constraints, refuse the shortcuts, and insist on evidence for each claim — including for the failure at the end of this post, which is the part I’d want someone to read if they only read one section.
The design in one line
NetBox says what should be listening. Nmap says what actually answers. These are never allowed to update each other.
That last part is the rule everything else hangs off. When the scanner finds a listening port that isn’t in the inventory, the wrong move is to add it to NetBox — that’s not reconciliation, it’s laundering an unknown into a fact. The right move is: compare, raise a finding, investigate, and let a human decide whether to document it or remove it.
Structurally, the platform cannot write to NetBox. The API token is read-only and I verified that by watching a write get refused — not by reading the checkbox I’d ticked. A control you haven’t watched refuse something isn’t known to work.
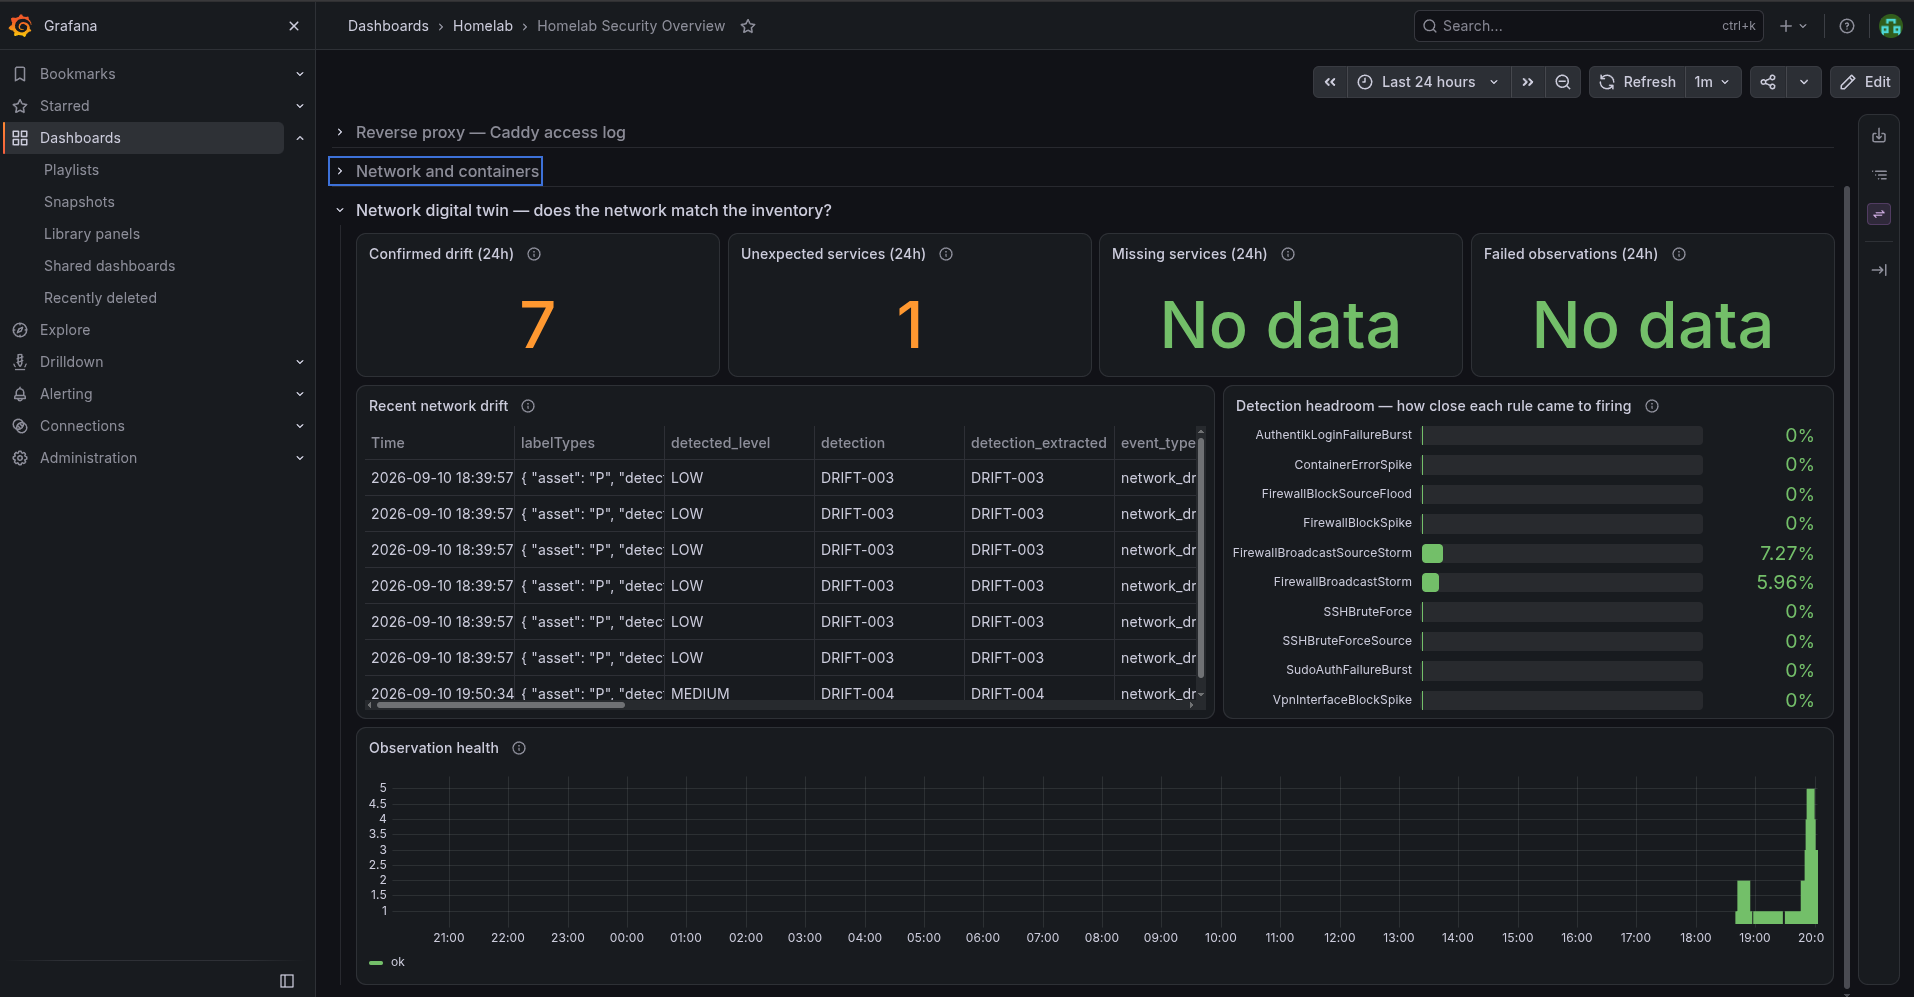
Phase 0 changed the design before a line was written
Two things I measured before building anything.
The VLAN segments are unobservable from this host. Routes to them exist via pfSense, but nothing answers on any of their gateways while the LAN gateway answers instantly. That’s my own segmentation working correctly — and it means an unobservable network is not an empty one. A diff engine that doesn’t know the difference reports every VLAN asset as permanently missing, forever, on correct behaviour. So the model records what was measured, and anything unmeasured defaults to unobservable rather than scannable.
My existing vulnerability scan was pointed at an address that no longer
exists. It scanned a hard-coded Docker bridge gateway; Docker had since
reassigned the subnet. Because the scan uses -Pn, a dead target doesn’t error
— nmap cheerfully reports the host as up with every port filtered. Fed to a
drift engine, that reads as “every service on the host disappeared at once”.
The observation engine now resolves the gateway at runtime from the network name, so it can’t rot the same way.
What the inventory looks like
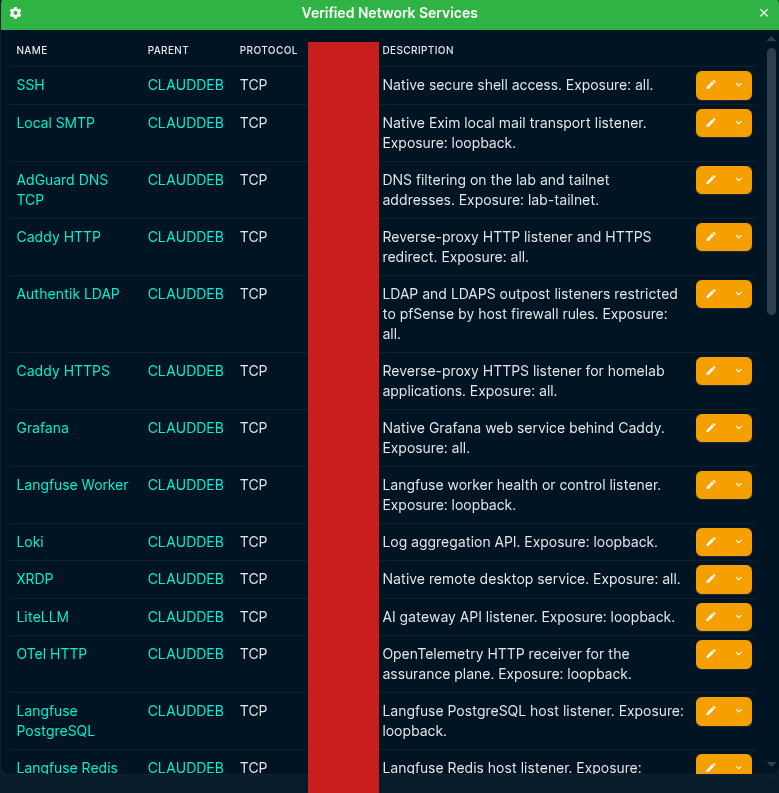
Thirty-four services, each with protocol, ports and an exposure classification derived from which network its address falls in — not stored per service, so correcting a prefix corrects everything on it.
Worth being honest about the state of this data: 20 of 36 expected service
rows have no IP binding. Their exposure isn’t “internal”, it’s unknown to the
inventory. The engine classifies those UNDECLARED rather than guessing,
because a guess written into a report becomes a fact by tomorrow. That’s an
inventory-completeness job for me, and it’s the main thing limiting exposure
drift detection today.
Not everything that differs is worth waking up for
A service is “missing” for one observation during any restart, redeploy or config reload. So findings have to survive repetition before they count:
| Finding | Observations to confirm |
|---|---|
| First sighting of a documented service | 1 |
| Undocumented service reachable | 2 |
| Fingerprint changed | 2 |
| Documented service stopped answering | 3 |
Counted in consecutive trustworthy observations, never wall-clock — an hour of failed scans must not age a finding into confirmation. And a candidate that disappears is cleared outright rather than decayed, because half-confirmed state that lingers is how a long-resolved condition fires days later.
A confirmed finding also reports once, not every fifteen minutes for as long as it persists.
Proving it with a real service
Unit tests all mock the scan, so they prove the logic above an observation without proving the observation. The only honest test is a real service.
I bound a benign listener on a port inside the scanned set, on the Docker bridge only:
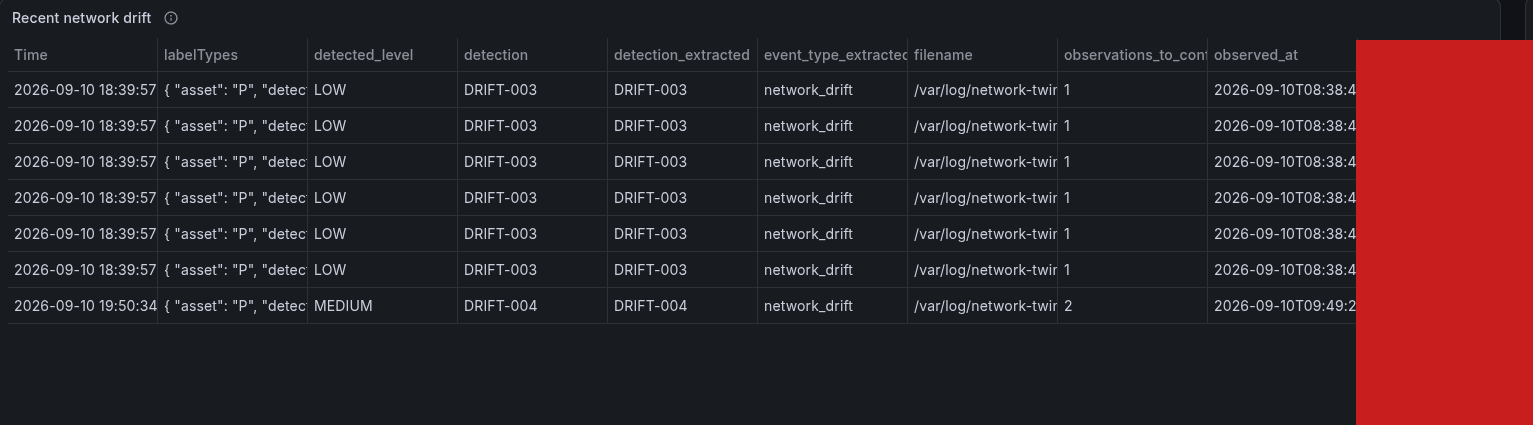
DRIFT-004, MEDIUM, confirmed after 2 observations. The first sighting
stayed pending and silent — exactly as intended. Then:
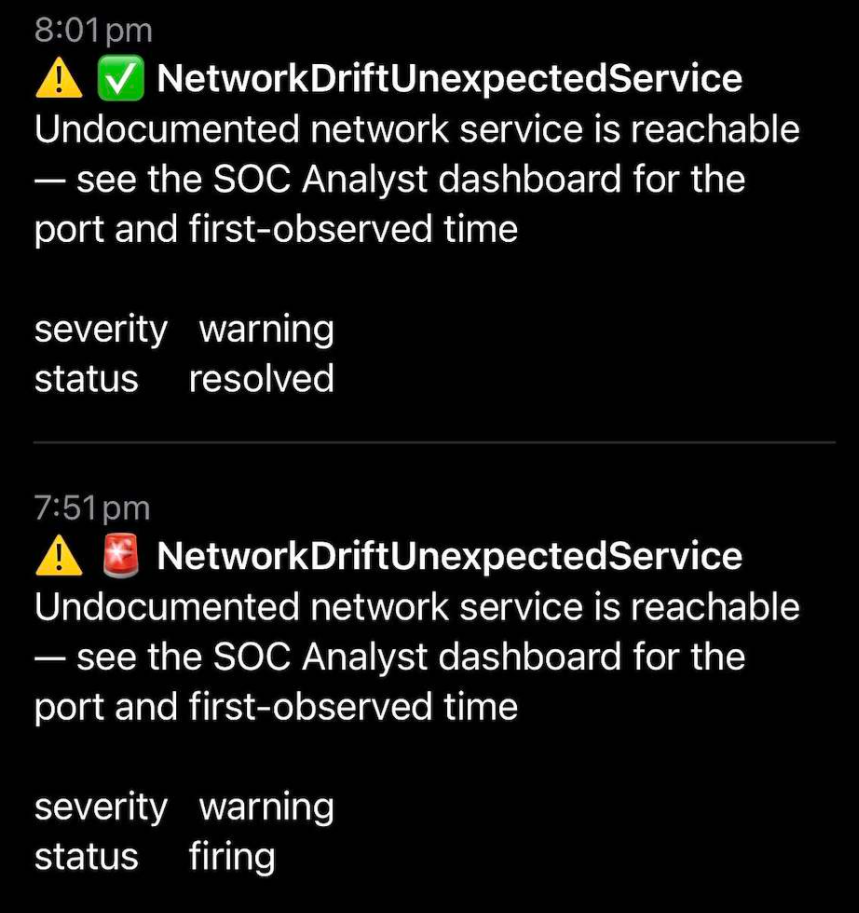
And the analyst picked it up from Alertmanager on its own:
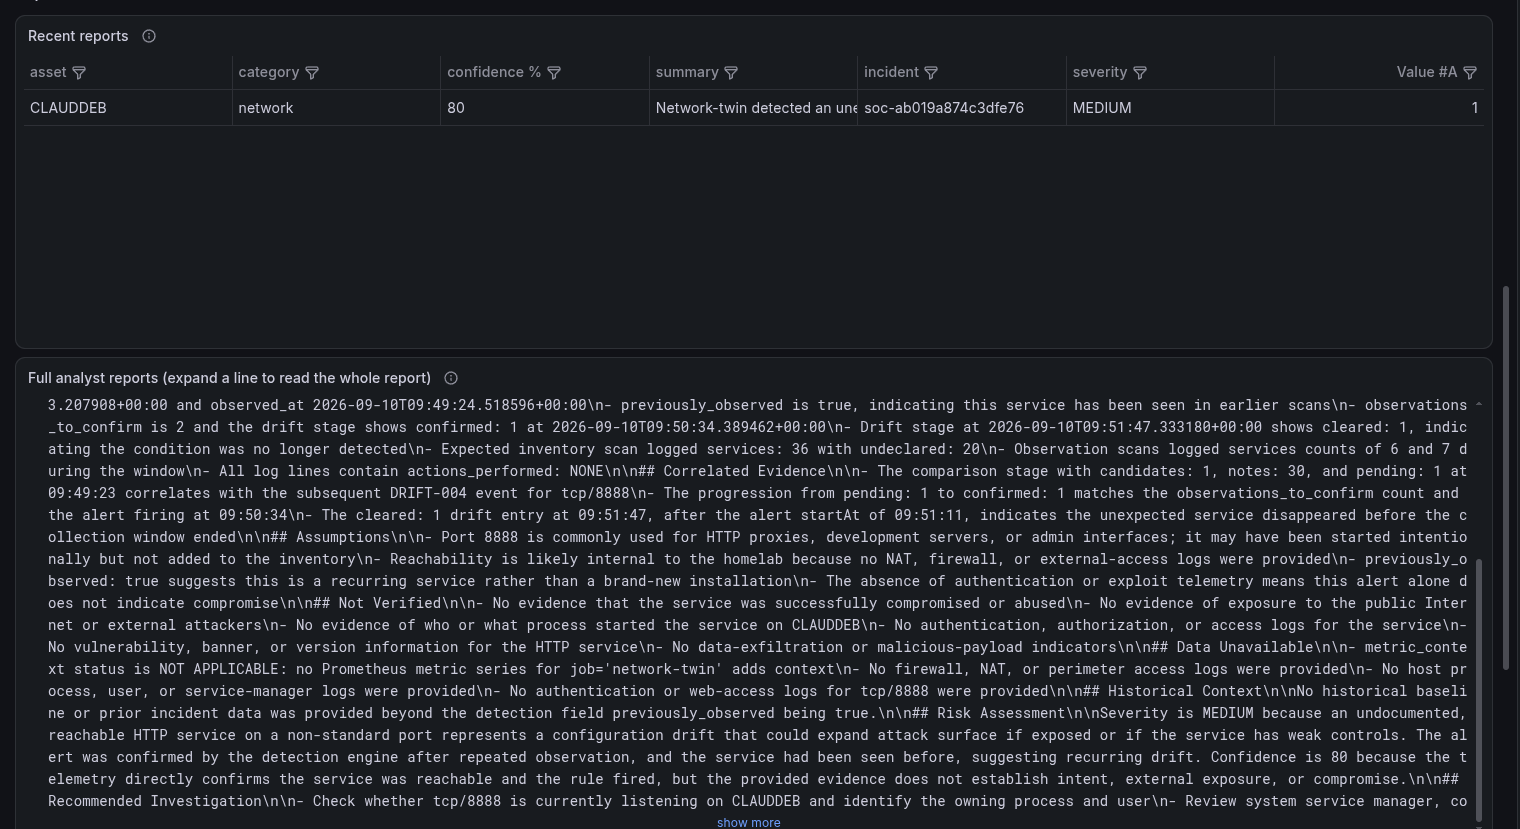
What I like about that report is that it traced the twin’s own reasoning —
noting that the progression from pending to confirmed matched the
observations_to_confirm count and the alert firing time — and that it noticed
the service had already gone. It called it undocumented, not malicious, and put
everything it couldn’t establish under Not Verified. It also had no idea
this was a test, and didn’t invent a story to explain the service.
The bit worth reading: a test that failed
Before that, I ran the same test on an uncommon high port. Nothing was detected.
Not a bug in the diff engine, the persistence logic, or the alerting. The scan uses nmap’s top 200 ports, and that port isn’t one of them. The observation never looked.
For a platform whose entire purpose is finding unexpected services, that’s backwards. An unexpected service on a common web port is usually a misconfiguration. One on an uncommon high port is the more suspicious case — and that’s precisely the case currently invisible. Something could sit up there indefinitely while the dashboard reported a clean match.
No unit test could have caught it. All sixty-eight of them mock the scan, so every one validates logic sitting above an observation that never looked. It took binding a real service on an arbitrary port, and I only picked an unusual one out of habit. Had I picked a common web port first, this would have passed cleanly and shipped with the hole intact.
That’s the third time in this lab I’ve hit the same shape: a control that looks correct, tests clean, and does nothing. First a firewall rule list that was completely inert. Then a dashboard panel reporting a healthy system as failing. Now a scan with a blind spot in the middle of its own purpose.
The fix — a second, connect-only sweep across the full port range without version detection — is written down along with an instruction to measure it rather than assume it’s cheap. It isn’t implemented yet, and I’d rather publish that honestly than quietly narrow the scope of the claim.
Seeing what never fires
A related gap, and my favourite panel in the build. Threshold rules are binary: they fired or they didn’t. A rule sitting at 90% of its threshold all week leaves no trace anywhere.
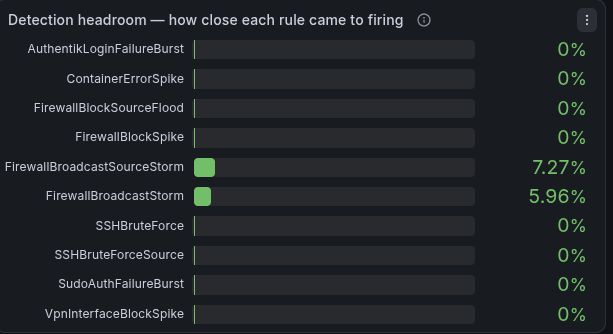
Thresholds are read from the rules themselves and never duplicated, so retuning a rule is followed automatically. Two alerts sit on this: one for sustained near-misses, and one for activity that stays low but persistent — the shape of a slow scan, which a threshold tuned for bursts is structurally blind to.
Those two are routed to a receiver with no webhook. They appear in Alertmanager and Grafana and never reach my phone, because a rule at 80% of threshold is worth knowing when I go looking and worthless at 3am.
The first version of the persistent-activity rule went pending ten minutes after
install, on a series ten minutes old — min_over_time over six hours doesn’t
require six hours of data. It now refuses to claim anything until it has at
least four hours of real samples. A near-miss detector’s first output being its
own false positive is funny exactly once.
Where it plugs in
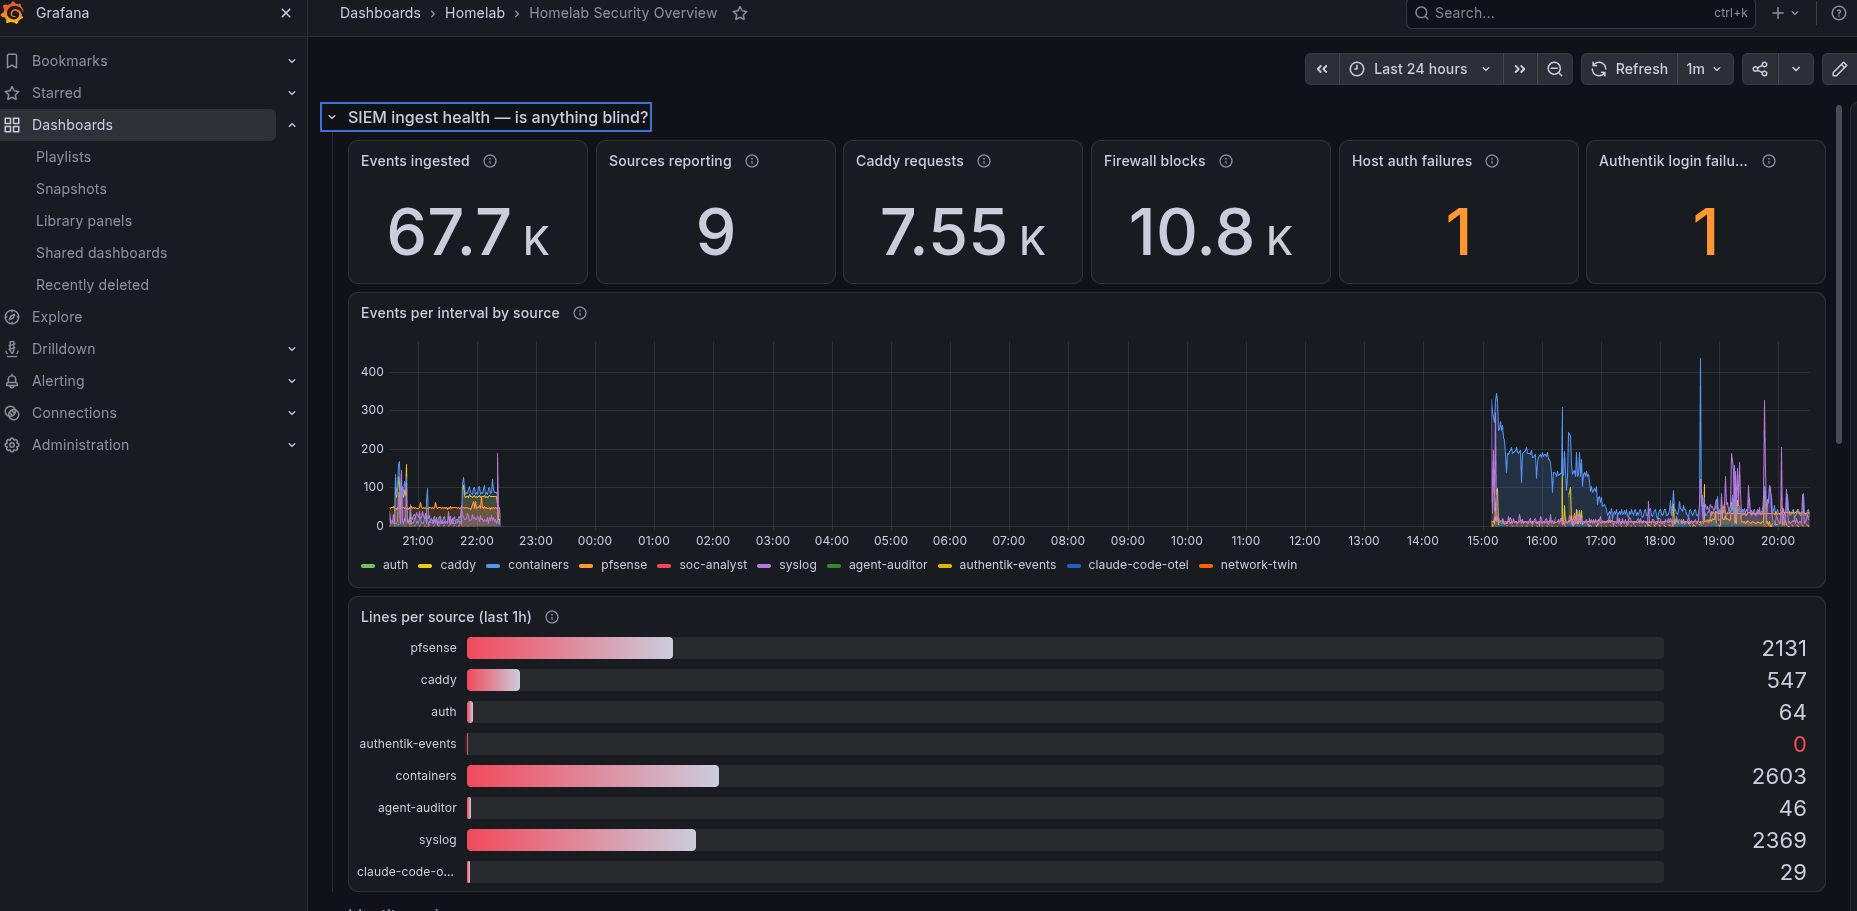
No parallel stack. Drift events are JSONL on disk, collected by the same Promtail that ships eight other sources, queried by the same Loki, alerted by the same Alertmanager, and displayed as one more row on the SOC dashboard I already had. The analyst needed a single mapping so it knows which logs to pull for a drift alert — no new tool, no new interface, no new capability.
What it cannot do
- No host discovery. It observes one target: this host’s own network surface. New or unknown hosts are not detectable, and those detections are declared unimplementable in the code rather than stubbed out to look complete.
- No exposure drift. That needs several vantage points to see which networks a service answers on, and most of my inventory has no address binding anyway.
- Only the top 200 ports, as above.
- The rollback has never been executed. It’s documented and untested, and an unrehearsed rollback is a claim rather than a control.
What I’d take from this
The baseline argument held up. Having a defined “normal” turned a question I’d have to think about — is this service suspicious? — into one I can answer immediately: is it in the inventory? That’s the difference between security that depends on me being sharp and security that works when I’m not.
But the thing I’ll actually remember is the failed test. Sixty-eight passing tests, a green dashboard, an alert on my phone, and a scan that wasn’t looking where it mattered most. Every one of those tests was true. None of them were looking at the right thing.