I wanted a real vulnerability scanner in the lab — something that port-scans a host, throws a big pile of network vulnerability tests at it, and tells me what to fix by severity. OpenVAS (now Greenbone Community Edition) is the obvious choice, and it ships as a Docker stack.
This is the honest write-up: the install, the three separate things that broke, one of which was my own fault, and what the scanner actually found when I pointed it at my own box. Nothing here is polished — I got a couple of things wrong along the way and I’m leaving those in, because that’s where the useful bits are.
The setup
It runs on my Debian home-lab VM (10.10.0.220), the same box my Claude agents run on behind pfSense. Greenbone Community Edition is 16 containers: gvmd (the manager and API, backed by PostgreSQL), gsa/gsad (the React web UI), nginx (TLS front end), ospd-openvas and openvas (the scanner itself), redis for per-scan state, and a handful of *-data containers that hold the vulnerability feed.
Versions I ended up on: gvmd 26.34.0 (GMP 22.7), GSA 27.5.0, OpenVAS scanner 23.49.0.
The install is the canonical container method — pull the official compose file and bring it up:
mkdir -p ~/greenbone && cd ~/greenbone
curl -f -L https://greenbone.github.io/docs/latest/_static/compose.yaml -o docker-compose.yml
sudo docker compose -p greenbone-community-edition pull
sudo docker compose -p greenbone-community-edition up -d
Then create the admin user, which runs inside the gvmd container:
sudo docker compose -p greenbone-community-edition exec -u gvmd gvmd \
  gvmd --create-user=admin --password='choose-something-long'
That’s the whole happy path. Now the parts that didn’t go to plan.
Break #1 — the web UI wouldn’t load
The stock compose maps 127.0.0.1:9392:9392. I hit it and got nothing useful:
curl -v  http://127.0.0.1:9392/   # redirect junk, not the app
curl -vk https://127.0.0.1:9392/  # also not the app
The cause took a minute to see. The nginx container’s port 9392 only issues a 301 redirect to :443 — the real HTTPS UI lives on 443 inside the container. But on this host Caddy already owns 443 (it reverse-proxies my other services), so the redirect target collided.
The fix is to map the host’s 9392 straight to the container’s 443 and skip the redirect entirely. In docker-compose.yml, under the nginx service:
    ports:
      # host loopback 9392 -> container 443 (the real HTTPS UI; container's 9392
      # only 301-redirects to :443, which collides with Caddy on this host).
      - 127.0.0.1:9392:443
sudo docker compose -p greenbone-community-edition up -d nginx
sudo ss -lntp | grep 9392
Now https://127.0.0.1:9392/ serves the login. It’s a self-signed cert bound to loopback only, so the browser warning is expected.
Break #2 — I locked myself out
This one was entirely me. While I was figuring things out I ran gvmd --create-user=admin twice with two different passwords. Every login attempt after that failed:
Login Failed. Invalid password or username.
create-user is create, not upsert. Running it again didn’t change the password — it left the account in a state where I no longer knew which password was live. The fix is to set the password explicitly instead of trying to “re-create” the user:
sudo docker compose -p greenbone-community-edition exec -u gvmd gvmd \
  gvmd --user=admin --new-password='choose-something-long'
# -> md manage: INFO: Modifying user password.
Login worked immediately after that. Lesson filed: to change a gvmd password, use --new-password, never a second --create-user.
The wait nobody warns you about
Before any scan is useful, the first boot has to download the feed — the ~183k network vulnerability tests plus SCAP and CERT data. Until that finishes, the dashboards are empty and the whole thing looks broken. It isn’t; it’s just downloading. I confirmed the feed was actually in before wasting time on a scan:
# NVTs loaded into the database?
sudo docker compose -p greenbone-community-edition exec pg-gvm \
  psql -U gvmd -d gvmd -tAc "select count(*) from nvts;"
# -> 183151

# scanner present and reachable?
sudo docker compose -p greenbone-community-edition exec -u gvmd gvmd \
  gvmd --verify-scanner=08b69003-5fc2-4037-a479-93b440211c73
# -> Scanner version: OpenVAS 23.49.0.
183,151 NVTs means the feed synced. Zero would mean wait longer.
Break #3 — a working scan that looked dead (and I made it worse)
I pointed the first scan at my own host, 10.10.0.220, with the Full and fast config and the All IANA assigned TCP port list. There’s no gvm-cli on the box, so I drove it over GMP by piping XML straight to the gvmd socket with socat inside the container:
printf '%s' '<authenticate><credentials><username>admin</username><password>…</password></credentials></authenticate><get_version/>' \
  | sudo docker compose -p greenbone-community-edition exec -T gvmd \
      sh -c 'socat -t 5 - UNIX-CONNECT:/run/gvmd/gvmd.sock'
The first scan aborted about three seconds in. The scanner log told the story:
libgvm boreas: Alive scan finished in 3 seconds: 1 alive hosts of 1.
sd main: attack_network: got NULL host, stop/finish scan
The alive test found the host, then the parent process immediately got a NULL host and stopped — a race in Boreas, the alive-detection stage. The task then sat at “Running 0%” forever as a zombie: the scanner subprocess was dead, but gvmd never got told.
Here’s the part I got wrong. In this build, gvmd progress sits at 0% for the entire scan and only jumps to 100% at the end. I didn’t know that yet, so when a second scan also showed 0% for a few minutes, I assumed it was stuck too — and stopped it. It wasn’t stuck. The scanner log showed it had been happily scanning the host for over five minutes. I killed a working scan because I misread a progress bar. Leaving that in because it’s the kind of mistake that’s easy to repeat: 0% here is not “stuck,” and the honest signal is the scanner log, not the percentage.
Two fixes got me a clean run:
1. Skip the Boreas race. Set the target’s alive test to Consider Alive, which tells the scanner to treat the host as up and go straight to scanning — no separate alive stage, no race:
<create_target>
  <name>self</name>
  <hosts>10.10.0.220</hosts>
  <alive_tests>Consider Alive</alive_tests>
</create_target>
2. Clear the wedged scanner. The aborted scan left dead state behind in redis, and a fresh scan wouldn’t spawn. Restarting just the scanner containers clears the transient scan state — the feed and all the gvmd data live in other containers, so nothing important is lost:
sudo docker compose -p greenbone-community-edition restart ospd-openvas openvas openvasd
After that the third run went through cleanly in about 13 minutes.
The meta-lesson is the same one that keeps coming up in this lab: every layer above the truth looked fine. The task said “Running.” ospd said “Starting scan.” The alive test said “1 alive host.” And nothing was actually scanning. The honest witnesses were one level down — the scanner’s own log, and whether an openvas process actually existed.
What the scan found
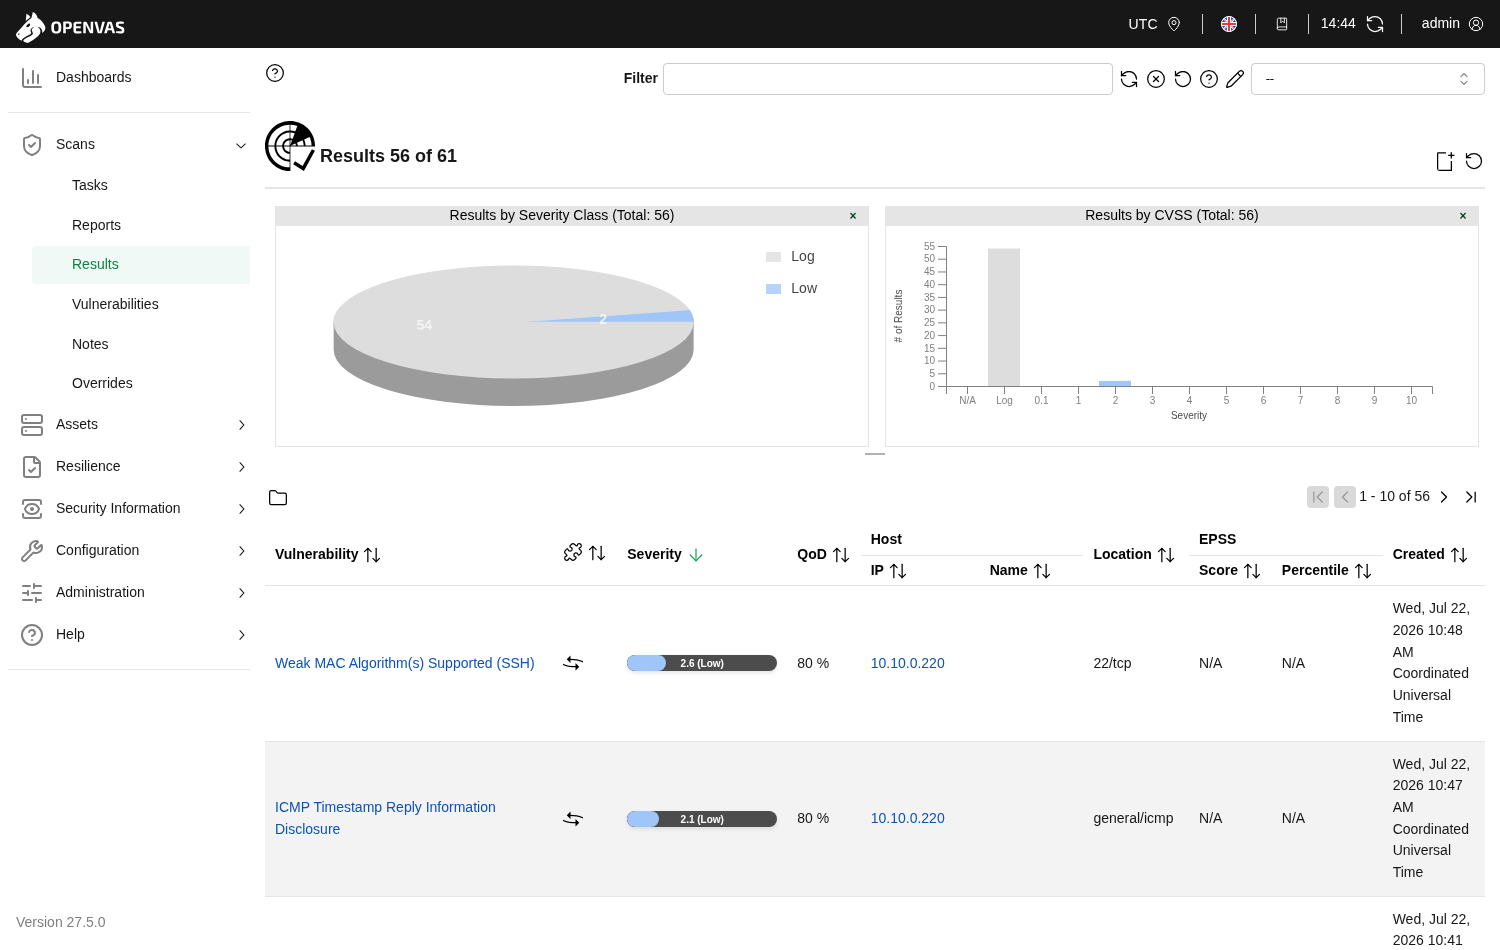
The result on my own box: 61 findings, zero High or Critical. The full breakdown was 2 Medium, 1 Low, 14 informational, and 44 log entries, with the highest severity at 5.0. For a Debian VM I’d already hardened, that’s about what I hoped for — but “no criticals” isn’t “nothing to do,” and the scan surfaced three real things worth tightening:
| Severity | Finding | Where | What I’ll do |
|---|---|---|---|
| Medium 5.0 | LDAP allows null bases | 389/tcp, 636/tcp | Disable the anonymous null-base bind / restrict the base DN |
| Low 2.6 | Weak MAC algorithm(s) supported (SSH) | 22/tcp | Prune the weak MACs from sshd_config |
| Low 2.1 | ICMP timestamp reply information disclosure | ICMP | Drop ICMP timestamp (type 13/14) at the firewall |
The two Medium findings are the same issue on both LDAP ports: the service answers anonymous queries with an empty base DN, which leaks directory structure to anyone who asks. There were also informational notes worth reading rather than dismissing — the Terrapin SSH attack (CVE-2023-48795), an older OpenSSH information-disclosure CVE, and the usual TLS cipher-suite reports.
None of it is dramatic, and that’s kind of the point. The value of running your own scanner isn’t a wall of criticals — it’s the boring, specific list of things that drifted or were never locked down: an LDAP service answering to nobody, a few weak SSH MACs, an ICMP reply I don’t need to be sending. That’s the list I actually work from.
Fixing what it found
A scan you don’t act on is just anxiety with a timestamp. So a day later I went back through the three findings, fixed each one, and re-ran the exact same scan to prove it.
LDAP null bases (389/636). The only thing that should ever talk to the Authentik LDAP outpost is pfSense — it’s the one service authenticating against it. Everything else on the LAN answering an anonymous query is just exposure. So I restricted those two ports to pfSense (10.10.0.1) and dropped the rest.
The wrinkle worth knowing: Docker publishes a port two different ways, and I had to block both. Real LAN clients arriving on the physical NIC get DNAT’d into the container and pass through the FORWARD chain. But traffic from other containers — and the scanner itself runs in a container — reaches the port through Docker’s userland docker-proxy and lands in INPUT instead. A rule on one hook silently misses the other. I know because my first attempt passed a quick test and the scanner still saw the port.
I did it with an additive nftables table — deliberately no flush ruleset, because this host runs Docker and flushing would wipe Docker’s own rules out from under it:
table inet lab_hardening {
	chain input {
		type filter hook input priority -10; policy accept;
		icmp type { timestamp-request, timestamp-reply } counter drop
		tcp dport { 389, 636 } ip saddr != 10.10.0.1 counter drop
	}
	chain forward {
		type filter hook forward priority -10; policy accept;
		ct status dnat tcp dport { 3389, 6636 } ip saddr != 10.10.0.1 counter drop
	}
}
Weak SSH MACs (22). A one-line drop-in keeping only the strong encrypt-then-MAC algorithms, dropping the umac-64 and hmac-sha1 variants the scanner flagged:
# /etc/ssh/sshd_config.d/70-crypto.conf
MACs [email protected],[email protected],[email protected]
sshd -t to validate, then systemctl reload ssh — never reload on an unvalidated config or a typo locks you out.
ICMP timestamp. That’s the timestamp-request drop in the table above. There’s no clean sysctl to disable it on Linux; the firewall is the right place.
Then the part that actually matters: I tested each fix from a container — the same vantage the scanner has, because testing from the host to its own IP takes a different code path and quietly lies to you — watched the drop counters climb, and re-ran the scan.
The re-scan
Same task, same target, same config. It took about two hours this time, up from under two before — and that slowdown is the fix working: the scanner now waits out the full timeout on every dropped probe instead of getting an instant refusal.
| First scan | After the fixes | |
|---|---|---|
| Critical / High | 0 | 0 |
| LDAP null bases (389, 636) | 2 × Medium | gone |
| Weak SSH MAC (22) | Low | gone |
| ICMP timestamp | Low | gone |
Zero critical, zero high, and the three I fixed are gone. What’s left is three findings on SSH, all tied to the OpenSSH version rather than anything in my config: the Terrapin attack (CVE-2023-48795), a disputed information-disclosure CVE, and a generic “you’re below the latest release” flag. The box is already on the current Debian OpenSSH, and Debian backports security fixes without bumping the version string — so a scanner reading version numbers over-reports these. Terrapin in particular is already mitigated by strict key exchange, which modern OpenSSH negotiates automatically; the flag really just means “you still offer the ChaCha20 cipher,” which I can drop if I want a clean sheet.
That’s the honest end state. The point of running your own scanner was never a wall of green — it’s the loop: scan, fix the specific things, run it again to prove the fix instead of assuming it. The findings that remain are noise I understand, which is a very different thing from findings I haven’t looked at.
How this actually got built
I’ll be straight about this, because it’s the whole reason this blog exists: I lean on Claude heavily, and a project like this doesn’t happen without it. Claude Code scripted the GMP-over-socket calls, read the scanner logs alongside me, and helped untangle the wedged-scanner state — I’m not going to pretend I’d have driven Greenbone over a raw Unix socket on my own in an afternoon.
But I don’t treat it as a black box, and that’s where the learning is. I’m the one deciding what to scan and why, working out why the Boreas race aborted the run, and turning a list of findings into an actual fix plan. Sitting in each failure — the port clash, my own login lockout, the scan that looked dead but wasn’t — is how I’m learning this tooling rather than just watching it work. The scanner is new to me; the debugging habits and the “trust the logs, not the status” instinct are the parts I’m keeping.
I wrote the whole thing up as a private runbook in my notes vault too — including the fix-and-re-scan cycle above — so next time I don’t rediscover the Caddy port clash or the Boreas race from scratch.