I run two coding agents against this lab. Codex found the problem and Claude Code fixed it, and keeping those two jobs in different hands turned out to be the most useful part of the whole exercise.
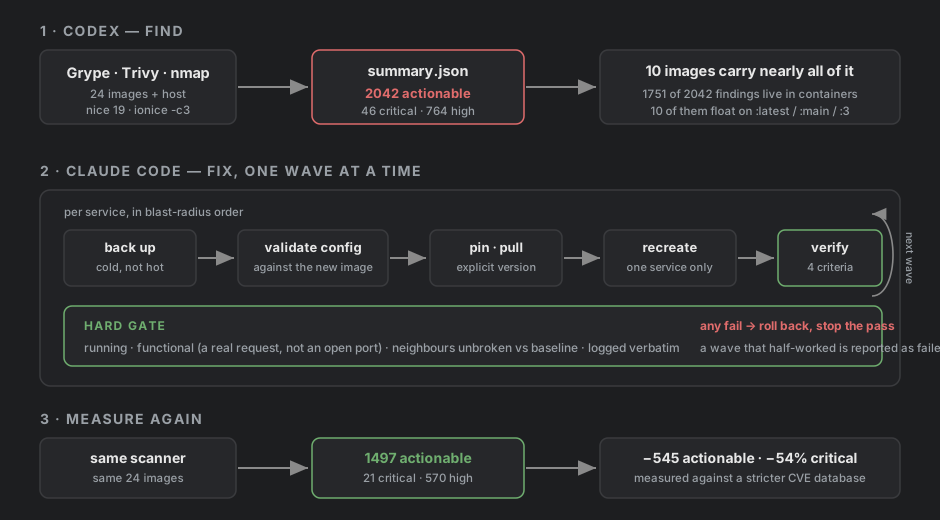
The short version: a full vulnerability scan reported 2042 actionable findings — 46 critical, 764 high — and 1751 of them were in container images. Ten waves of updates later, the same scanner reports 1497 actionable, 21 critical, 570 high.
Why there was a scan at all
I used to run OpenVAS. I decommissioned it — it ate memory on a VM that had none to spare, and for the effort it cost me the analytical output was thin. I’ve since given this box more RAM and more vCPU, but by then I’d already replaced it with something lighter: Grype per image, Trivy for rootfs and config, nmap for the network surface, all wrapped in one script that writes a summary.json my dashboard reads.
That scan is the thing my Codex agent runs. This post is what happened when I pointed Claude Code at its output.
The finding underneath the finding
The 2042 number was not the interesting part. This was:
$ grep -c "image:.*:latest\|image:.*:main\|image:.*:3$" */docker-compose.yml
Ten of my images floated on :latest, :main, a bare :3, or — in minio’s case — no tag at all. My own patch automation says so out loud:
Docker images are out of scope … a separate design with its own restart-approval question.
So I had a lab where I could not answer “what version is running?” for a third of it, and therefore could not roll anything back. Updating was the visible job. Making the next update reversible was the real one.
That reframed the whole pass: pin everything to an explicit version, and record every current digest before touching anything.
docker inspect --format '{{.Name}} {{.Config.Image}} {{index .Image}}' $(docker ps -q) \
  > pre-update-digests.txt
That file is the rollback path for every tag that used to float.
Setting it up so a bad wave couldn’t cost me the lab
Before any of it ran I took a full clone of the entire homelab VM and put it on an external drive. That is the total-loss fallback. Everything else is per-service.
The per-service backups took a while because two of them taught me something.
A tar of a live SQLite database is not a backup. Vaultwarden and n8n both run SQLite with WAL. Tarring those files while the process is writing gives you a file that looks fine and restores wrong. For vaultwarden I used the backup API against a read-only handle:
s = sqlite3.connect('file:/home/student/vaultwarden/data/db.sqlite3?mode=ro', uri=True)
d = sqlite3.connect(dst)
with d: s.backup(d)
For n8n I pulled the new image first, stopped the container, and only then tarred the volume — so the outage was seconds and the archive was consistent.
A hot tar of ClickHouse is worse, because it fails loudly and you might not notice. My first attempt threw:
tar: ./store/.../202608_75870_75870_0: No such file or directory
ClickHouse was merging parts and deleting them underneath the tar. I renamed that file …INCONSISTENT-hot-tar.tar.gz so nobody — including me, three weeks later — could mistake it for a restore point, and re-took it properly with the stack stopped. Same volume, cold:
docker compose stop
docker run --rm -v langfuse_langfuse_clickhouse_data:/v:ro -v $BK:/b alpine \
  tar czf /b/clickhouse_data-COLD.tar.gz -C /v .
docker compose up -d
1.1 GB, 53,022 entries, zero errors. Eight minutes of downtime, nearly all of it the backup rather than the upgrade.
The gate
Ten waves, ordered by blast radius — alertmanager first because nothing depends on it, ingress last because everything does. Between every wave, four things had to be true before the next one started:
- Running — container up, and
healthywhere a healthcheck exists.Upon its own proves nothing; a container can be up with the application dead behind it. - Functional — a real request succeeds. An HTTP 200 on the actual vhost, a query returning rows, a login completing. Not a port being open.
- Neighbours unbroken —
docker ps -adiffed against the pre-change baseline. 28 containers, no new restart loops anywhere else. - Logged — the wave’s commands and their real output, verbatim, pass or fail.
Any failure meant roll that service back, write down what happened, and stop the pass rather than carry a broken service into the next wave. A wave that half-worked gets reported as failed.
Nothing needed rolling back. But the gate did most of its work before each change, not after.
Validating against the new image, before touching the old one
This is the habit that paid off most. You can run the new image against your existing config without disturbing anything:
docker run --rm -v /home/student/loki/loki-config.yml:/etc/loki/loki-config.yml:ro \
  grafana/loki:3.7.6 -config.file=/etc/loki/loki-config.yml -verify-config
# config is valid

docker run --rm -v /home/student/loki/promtail-config.yml:/etc/promtail/promtail-config.yml:ro \
  grafana/promtail:3.6.11 -config.file=/etc/promtail/promtail-config.yml -check-syntax
# Valid config file!
Loki 3.4 → 3.7 is the kind of jump where a config schema change bites, and the answer arrived in two seconds with the live container still serving.
The same trick answered the wave I was most worried about.
Homepage v2.0.0, or: test the image instead of reading about it
Homepage shipped a major version with a breaking authentication change, three days before I got to it. The release notes list it as one line — “Feature: homepage auth” — with no detail. Both documentation URLs I tried returned 404. The pull request page wouldn’t render its own body.
My dashboard sits behind Authentik forward-auth already. If v2’s built-in auth defaulted on, I’d get a second login prompt stacked on the first, or a lockout.
Rather than guess, I booted the new image in a throwaway container against a copy of my config, on a port nothing uses:
cp -r ~/homepage/config/. /tmp/hp-v2-test/ && rm -rf /tmp/hp-v2-test/logs
docker run -d --name homepage-v2-test -p 127.0.0.1:8399:3000 \
  -v /tmp/hp-v2-test:/app/config -e HOMEPAGE_ALLOWED_HOSTS=localhost:8399 \
  ghcr.io/gethomepage/homepage:v2.0.0

curl -H 'Host: localhost:8399' http://127.0.0.1:8399/             # 200, no redirect
curl -H 'Host: localhost:8399' http://127.0.0.1:8399/api/services # 200, all 7 groups
Auth is opt-in. An install with no auth config keeps serving exactly as before. The only “Login” strings in the HTML turned out to be the Authentik widget’s own labels — Logins (24h), Failed Logins. v2’s skeleton config set is identical to v1’s, and the test run created no new files.
Ten minutes to know, instead of a guess and a rollback.
Where the plan was wrong
Three of my target versions didn’t survive contact.
LiteLLM has no v1.97.0-stable. I’d planned to pin the -stable tag on principle. I paginated all 2509 tags on the registry: 460 contain stable, and the newest is v1.83.14-stable — fourteen minor versions behind. That train stopped. I pinned the plain v1.97.0, which is what GitHub marks Latest.
Promtail has no 3.7.x. Loki went to 3.7.6; promtail’s line ends at 3.6.11. They’re not released in lockstep any more because Grafana is steering people to Alloy. Pinning them to matching numbers would have failed on a tag that doesn’t exist.
AdGuard and Caddy weren’t upgrades at all. Both were already running the newest version via their floating tags. Pinning them changed no bytes — :latest and :v0.107.78 resolved to the identical digest. That still mattered: before, a rebuild could silently move them with nothing recorded.
The thing that only bit after the upgrade succeeded
Authentik went 2026.5.4 → 2026.5.6 cleanly. Server and worker healthy, no schema migrations, all five forward-auth apps still gating.
Then the admin UI showed both standalone outposts — LDAP and RADIUS, the ones pfSense authenticates against — as unhealthy.
They weren’t down. They were checking in fine; they were still on 2026.5.4 while the core had moved to 2026.5.6, and Authentik renders a version mismatch the same alarming way it renders an outage. I confirmed it by reading the state Authentik itself caches:
ldap      last_seen: current   version 2026.5.4
radius    last_seen: current   version 2026.5.4
embedded  last_seen: current   version 2026.5.6   <- upgraded with the core
The embedded outpost upgraded because it ships inside the server container. The two standalone ones are managed by the worker over the Docker socket, and the task that reconciles them runs on a schedule:
authentik.outposts.tasks.outpost_controller cron: 21 */4 * * *
Every four hours, at :21. The next fire after my upgrade landed at 02:21 local — and this lab shuts down overnight. It would have missed that window every single night, indefinitely. On a lab that isn’t 24/7, outpost reconciliation after a core upgrade has to be triggered by hand.
The fix is a save with no changes, which enqueues the controller immediately. Two things cost me time getting there and are worth writing down:
- Outposts live under Applications, not System. System has Outpost Integrations, which is the Docker service connection — a different page with a near-identical name. The route is
/if/admin/#/outpost/outposts. - After the recreate, both outposts showed “last seen: 57 years ago.” That’s a ghost. Outpost health is cached per container instance; when the controller replaces a container the dead instance’s entry stops refreshing, freezes at the Unix epoch — 1970, hence 57 years — and keeps advertising the old version until its TTL expires. About three minutes. Nothing to chase.
What the second scan actually said
Same scanner, same 24 images, two days later.
| before | after | ||
|---|---|---|---|
| Actionable findings | 2042 | 1497 | −545 (−27%) |
| Critical | 46 | 21 | −25 (−54%) |
| High | 764 | 570 | −194 (−25%) |
| — in container images | 1751 | 1191 | −560 (−32%) |
| — host-side | 291 | 306 | +15 |
| Known-exploited (KEV) | 0 | 0 | — |
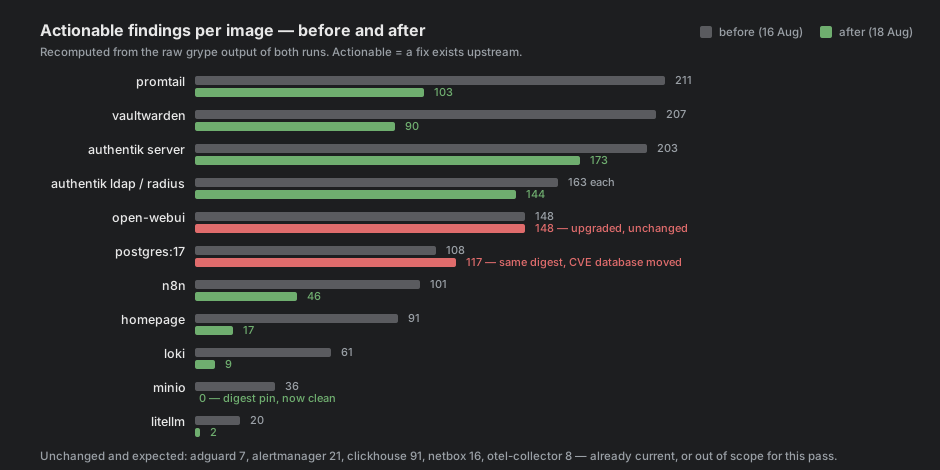
I recomputed both runs from the raw scanner JSON rather than trusting the summary I’d written down two days earlier, which is how I caught the two results below.
The two numbers that went the wrong way
Open WebUI did not improve at all: 148 → 148.
The upgrade was real — :main and 0.11.0 are genuinely different images, different digests — and the fixable-finding count is byte-for-byte identical. Its vulnerabilities live in base layers and bundled dependencies that the release doesn’t address. It’s now my single largest remaining image, 12% of everything left. Pinning it bought me reproducibility and nothing else. I’d assumed a release pin implies fewer findings. For this image that was simply false.
Postgres 17 got worse on an image that never changed: 108 → 117.
Same digest in both runs — sha256:2afea7538da73a2b before and after. The image is identical. The nine extra findings are the vulnerability database moving: Grype learned about nine more fixable CVEs for that unchanged image in two days.
That one reframes the headline. Part of any multi-day delta is the CVE database shifting under you, not your estimate being wrong — and here an unchanged image proves the direction. The database got stricter. So the −545 is measured against a harder standard than the baseline was, and if anything it understates the improvement.
It also means a scan number is a measurement with a timestamp, not a score. Comparing two runs is only honest if you can point at something that didn’t change and show what it did.
What I’m not claiming
no_fix: 7588 of 9085 total findings. Most of what a scanner reports has no upstream fix and nobody can action it — the 1497 are the ones anybody can do something about, and that distinction is the difference between a useful report and a wall of red.
Host-side findings went up, 291 → 306. That’s apt and system binaries, deliberately out of scope here, and subject to the same database drift.
And 1497 remaining is not “secure”. It’s smaller. Open WebUI alone accounts for 148 of it and won’t move without upstream changing its base image.
What I’d keep
The split between the two agents was the useful structure — not because one model is better, but because the agent that finds the problem shouldn’t be the one grading its own fix. Codex measured before, Claude Code changed things, and the same scanner measured after. Nothing in the middle got to mark its own homework.
Beyond that, three habits:
- Validate the new image against the real config before recreating anything. Two seconds, and it catches config schema drift while the old container is still serving.
- Record digests before you touch a floating tag. Otherwise there is no rollback, only hope.
- Take backups cold when the thing writes constantly. SQLite under WAL and ClickHouse mid-merge will both hand you an archive that looks fine and isn’t.
The pass also left me a to-do it didn’t cause: my backup watchdog fires at 18:00 and the backup itself runs at 20:30, so the watchdog structurally cannot detect a missing backup. The upgrade preserved that schedule exactly, which is how I noticed it. That’s the next post’s problem.