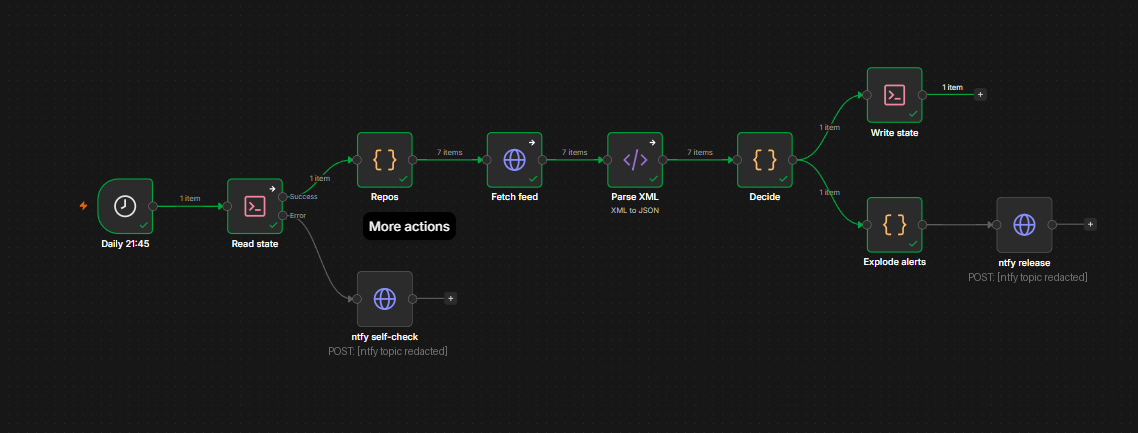
The finished Release Watch workflow in n8n: schedule, state read, repo list, feed fetch, XML parse, decide, state write, and two ntfy branches

Patching a Homelab Has Two Halves — and Only One of Them Is apt

Two halves apt patches Debian. My homelab is not Debian — it’s about a dozen containers sitting on top of Debian. AdGuard, Authentik, Vaultwarden, Caddy, n8n, Greenbone, Homepage. apt will never once mention that Vaultwarden cut a release. So “keep the lab patched” is really two jobs: Debian packages — unattended-upgrades, already a solved problem, just needs scheduling and a report. Everything I actually run — nobody’s solved that for me. Containers only update when I decide to pull. This post is both halves. The first one taught me something uncomfortable about monitoring, so I’ll start there. ...
1 August 2026 · 13 min
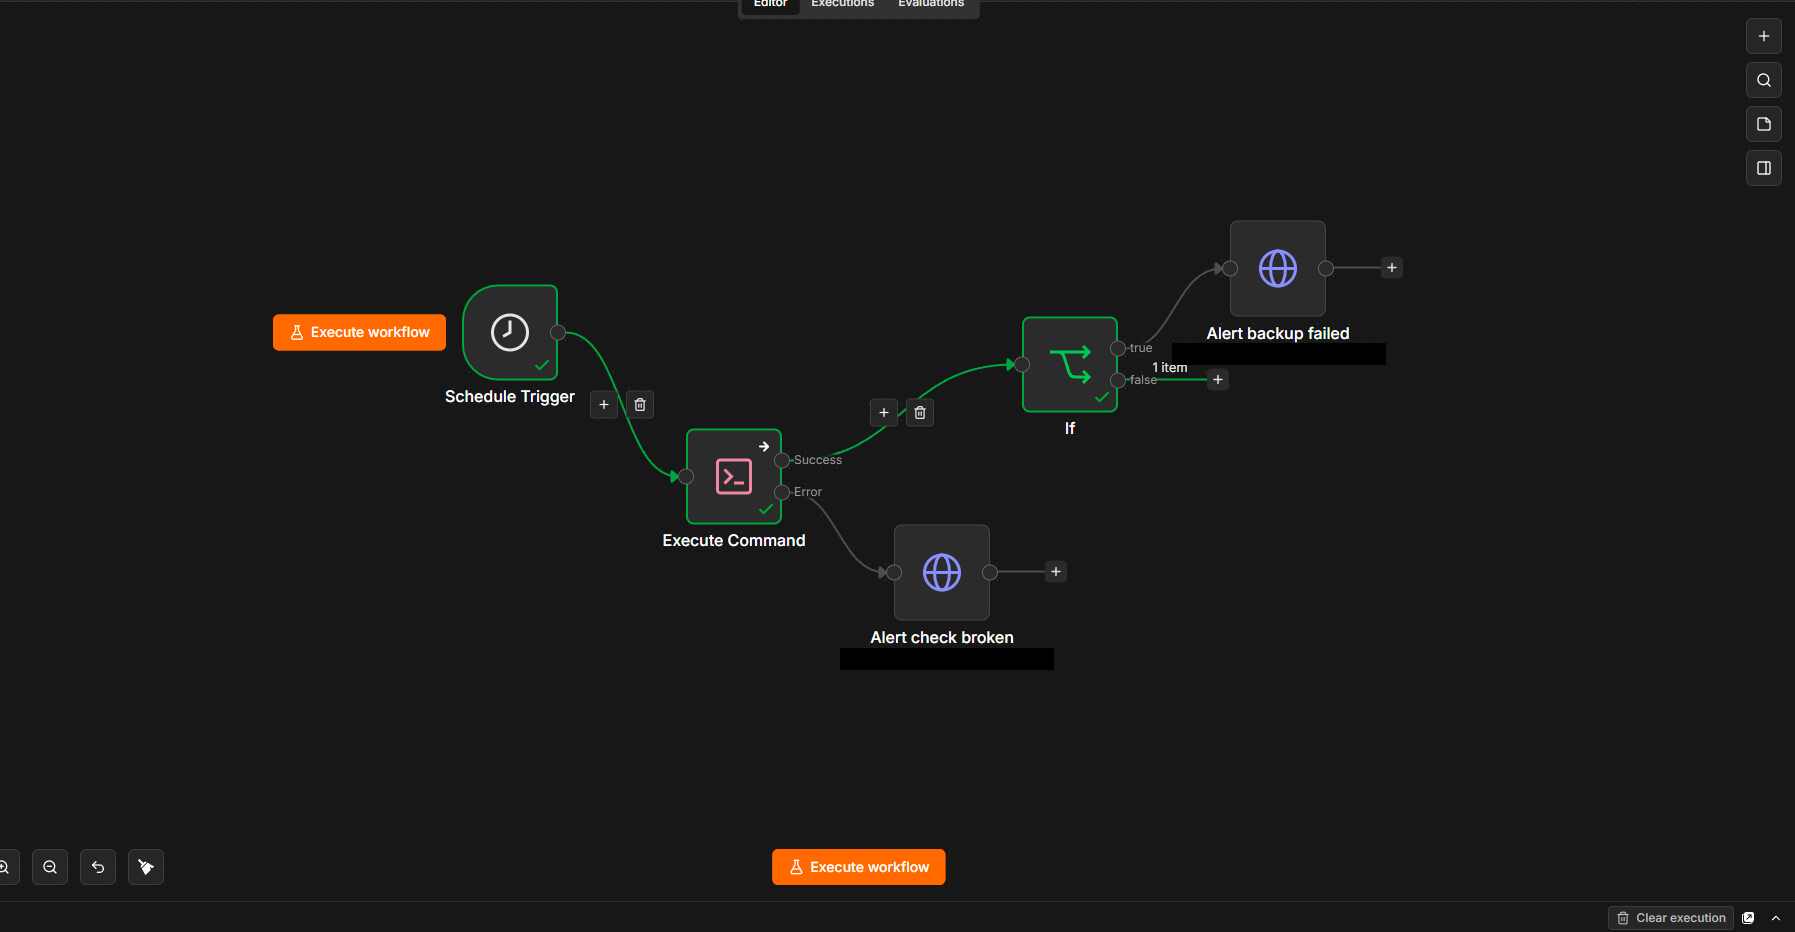
The finished four-node n8n workflow: Schedule Trigger, Execute Command, IF, and two ntfy alert nodes

Building a Backup Watchdog in n8n — and Finding a Five-Day Outage While I Did It

The problem I set out to solve My homelab takes a backup every night at 20:30. A cron job runs a script, the script dumps my Authentik database, snapshots the Vaultwarden vault, tars up the configs, encrypts a copy with age and drops it into OneDrive. It writes everything it does to /var/log/lab-backup.log. And nobody reads /var/log/lab-backup.log. That was the thing bothering me. If the backup silently stopped, I wouldn’t find out when it stopped — I’d find out the day I needed a restore, which is the worst possible day to learn anything. So the plan was simple: get n8n to check the backup actually happened, and buzz my phone if it didn’t. ...

23 July 2026 · 13 min
RAINBOW MATRIX cover — the post title in rainbow monospace over falling matrix rain on black

Metrics You Have to Remember to Look At Aren't Monitoring

I’d had Grafana dashboards for months. What I didn’t have was anything that told me when something broke — I had to remember to look. This is the alerting layer that fixes that, built on top of the existing Prometheus stack, plus the three things that got in the way. Stack: Prometheus · Alertmanager · ntfy · Docker 1. The gap I’d been ignoring My lab had a healthy observability stack: Prometheus scraping metrics, node_exporter for the host, snmp_exporter pulling throughput off pfSense, all drawn in Grafana. It looked complete. ...

18 July 2026 · 12 min
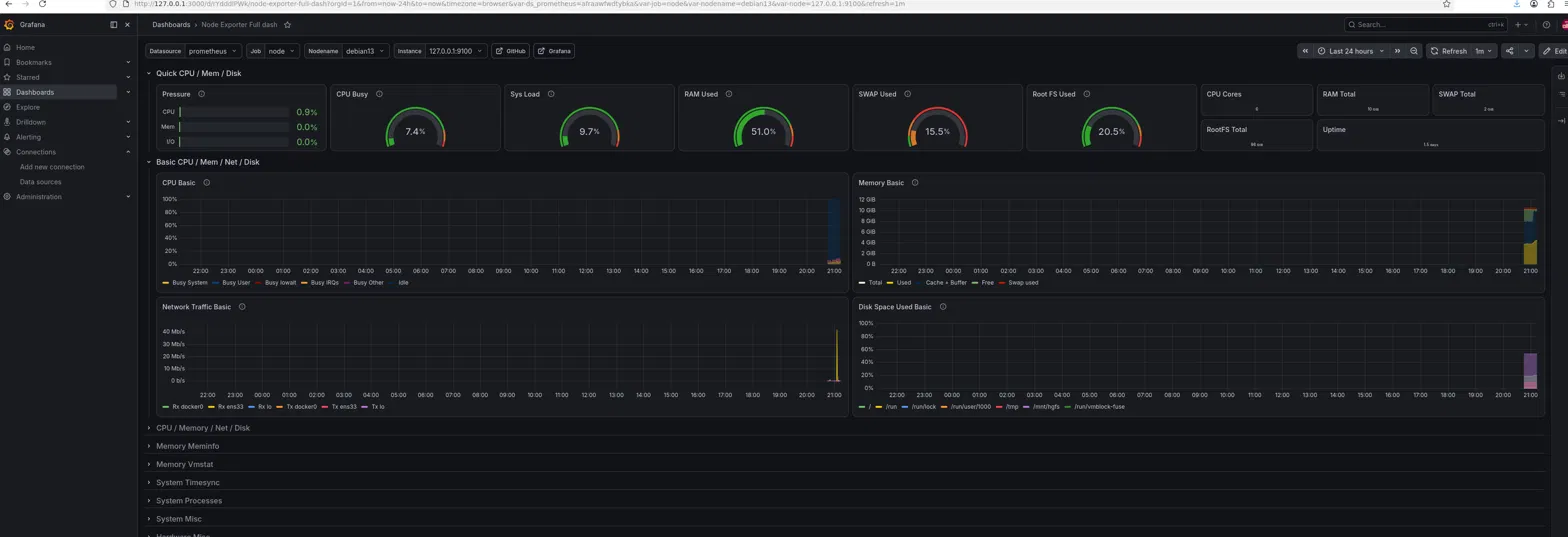
Grafana Node Exporter dashboard for the Debian VM

Building a Prometheus and Grafana Observability Stack for My Home Lab

My LaMetric display gives an at-a-glance read on the lab, but it’s a spot reading with no history — good for “is something on fire right now,” useless for “what happened overnight.” This project adds the layer underneath: a Prometheus + Grafana stack that scrapes my hosts continuously, stores the history, and draws real dashboards. Two targets: CLAUDDEB (my Debian automation VM) and my pfSense firewall, reusing the exact SNMP setup from the pfSense post — just pointed at something far more capable than a 37-pixel display. ...

6 July 2026 · 6 min