RAINBOW MATRIX cover — the post title in rainbow monospace over falling matrix rain on black

Metrics You Have to Remember to Look At Aren't Monitoring

I’d had Grafana dashboards for months. What I didn’t have was anything that told me when something broke — I had to remember to look. This is the alerting layer that fixes that, built on top of the existing Prometheus stack, plus the three things that got in the way. Stack: Prometheus · Alertmanager · ntfy · Docker 1. The gap I’d been ignoring My lab had a healthy observability stack: Prometheus scraping metrics, node_exporter for the host, snmp_exporter pulling throughput off pfSense, all drawn in Grafana. It looked complete. ...
18 July 2026 · 12 min
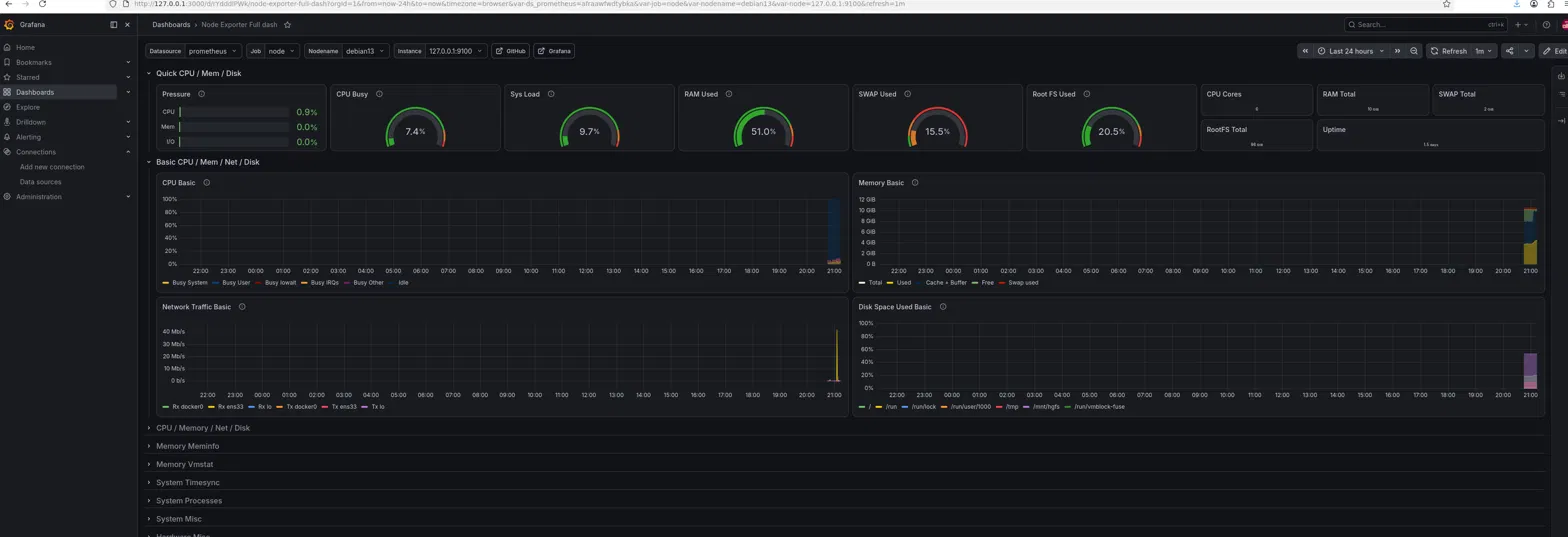
Grafana Node Exporter dashboard for the Debian VM

Building a Prometheus and Grafana Observability Stack for My Home Lab

My LaMetric display gives an at-a-glance read on the lab, but it’s a spot reading with no history — good for “is something on fire right now,” useless for “what happened overnight.” This project adds the layer underneath: a Prometheus + Grafana stack that scrapes my hosts continuously, stores the history, and draws real dashboards. Two targets: CLAUDDEB (my Debian automation VM) and my pfSense firewall, reusing the exact SNMP setup from the pfSense post — just pointed at something far more capable than a 37-pixel display. ...

6 July 2026 · 6 min